Safeway 2008 Annual Report Download - page 72
Download and view the complete annual report
Please find page 72 of the 2008 Safeway annual report below. You can navigate through the pages in the report by either clicking on the pages listed below, or by using the keyword search tool below to find specific information within the annual report.-
 1
1 -
2
-
3
-
4
-
5
-
6
-
7
-
8
-
9
-
10
-
11
-
12
-
13
-
14
-
15
-
16
-
17
-
18
-
19
-
20
-
21
-
22
-
23
-
24
-
25
-
26
-
27
-
28
-
29
-
30
-
31
-
32
-
33
-
34
-
35
-
36
-
37
-
38
-
39
-
40
-
41
-
42
-
43
-
44
-
45
-
46
-
47
-
48
-
49
-
50
-
51
-
52
-
53
-
54
-
55
-
56
-
57
-
58
-
59
-
60
-
61
-
 62
62 -
 63
63 -
 64
64 -
 65
65 -
 66
66 -
 67
67 -
 68
68 -
 69
69 -
 70
70 -
 71
71 -
 72
72 -
 73
73 -
 74
74 -
 75
75 -
 76
76 -
 77
77 -
 78
78 -
 79
79 -
 80
80 -
 81
81 -
 82
82 -
83
-
84
-
85
-
86
-
87
-
88
-
89
-
90
-
91
-
92
-
93
-
94
-
95
-
96
-
97
-
98
-
99
-
100
-
101
-
102
-
103
-
104
 |
 |

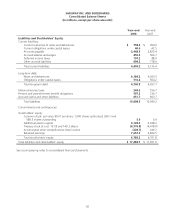
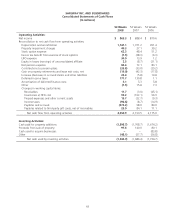
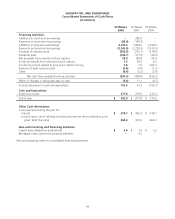
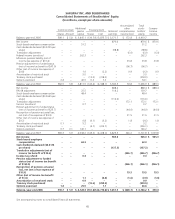
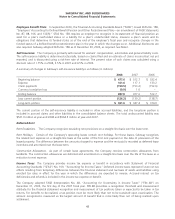
SAFEWAY INC. AND SUBSIDIARIES
Notes to Consolidated Financial Statements
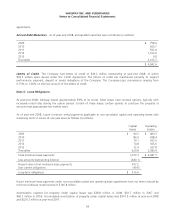
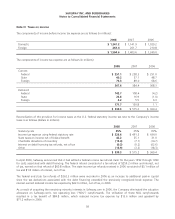
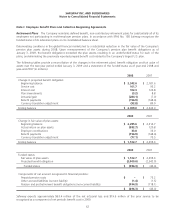
Store Lease Exit Costs The reserve for store lease exit costs includes the following activity for 2008, 2007 and 2006 (in
millions):
2008 2007 2006
Beginning balance $ 128.2 $ 126.7 $ 156.0
Provision for estimated net future cash flows of additional closed stores (1) 3.5 31.5 0.1
Net cash flows, interest accretion, changes in estimates of net future cash flows (31.6) (30.0) (29.4)
Ending balance $ 100.1 $ 128.2 $ 126.7
(1) Estimated net future cash flows represents future minimum lease payments and related ancillary costs from the date of closure to
the end of the remaining lease term, net of estimated cost recoveries that may be achieved through subletting properties or through
favorable lease terminations.
Store lease exit costs are included as a component of operating and administrative expense, and the liability is included in
accrued claims and other liabilities.
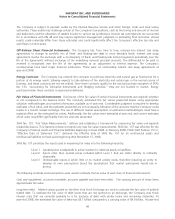
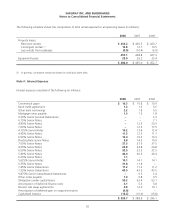
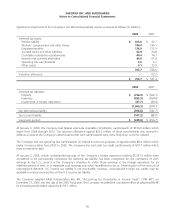
Note D: Financing
Notes and debentures were composed of the following at year end (in millions):
2008 2007
Commercial paper $ 362.1 $ 25.0
Bank credit agreement, unsecured ––
Other bank borrowings, unsecured 3.2 99.7
Mortgage notes payable, secured 17.0 20.1
4.125% Senior Notes due 2008, unsecured –300.0
4.45% Senior Notes due 2008, unsecured –301.1
6.50% Senior Notes due 2008, unsecured –250.0
Floating Rate Notes due March 2009, unsecured (interest at 1.82% as of January 3, 2009) 250.0 250.0
7.50% Senior Notes due September 2009, unsecured 500.0 500.0
4.95% Senior Notes due 2010, unsecured 500.0 500.0
6.50% Senior Notes due 2011, unsecured 500.0 500.0
5.80% Senior Notes due 2012, unsecured 800.0 800.0
6.25% Senior Notes due 2014, unsecured 500.0 –
5.625% Senior Notes due 2014, unsecured 250.0 250.0
6.35% Senior Notes due 2017, unsecured 500.0 500.0
7.45% Senior Debentures due 2027, unsecured 150.0 150.0
7.25% Senior Debentures due 2031, unsecured 600.0 600.0
Other notes payable, unsecured 7.7 2.5
Unamortized deferred gain on swap termination 2.6 –
4,942.6 5,048.4
Less current maturities (758.4) (954.9)
Long-term portion $ 4,184.2 $ 4,093.5
Commercial Paper The amount of commercial paper borrowings is limited to the unused borrowing capacity under the
bank credit agreement. Commercial paper is classified as long term because the Company intends to and has the ability
to refinance these borrowings on a long-term basis through either continued commercial paper borrowings or utilization
of the bank credit agreement, which matures in 2012. The weighted-average interest rate on commercial paper
borrowings during 2008 was 4.31% and 5.82% at year-end 2008.
52