Safeway 2008 Annual Report Download - page 63
Download and view the complete annual report
Please find page 63 of the 2008 Safeway annual report below. You can navigate through the pages in the report by either clicking on the pages listed below, or by using the keyword search tool below to find specific information within the annual report.-
 1
1 -
2
-
3
-
4
-
5
-
6
-
7
-
8
-
9
-
10
-
11
-
12
-
13
-
14
-
15
-
16
-
17
-
18
-
19
-
20
-
21
-
22
-
23
-
24
-
25
-
26
-
27
-
28
-
29
-
30
-
31
-
32
-
33
-
34
-
35
-
36
-
37
-
38
-
39
-
40
-
41
-
42
-
43
-
44
-
45
-
46
-
47
-
48
-
49
-
50
-
51
-
52
-
 53
53 -
 54
54 -
 55
55 -
 56
56 -
 57
57 -
 58
58 -
 59
59 -
 60
60 -
 61
61 -
 62
62 -
 63
63 -
 64
64 -
 65
65 -
 66
66 -
 67
67 -
 68
68 -
 69
69 -
 70
70 -
 71
71 -
 72
72 -
 73
73 -
74
-
75
-
76
-
77
-
78
-
79
-
80
-
81
-
82
-
83
-
84
-
85
-
86
-
87
-
88
-
89
-
90
-
91
-
92
-
93
-
94
-
95
-
96
-
97
-
98
-
99
-
100
-
101
-
102
-
103
-
104
 |
 |

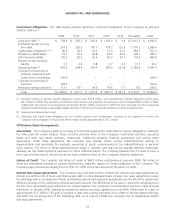
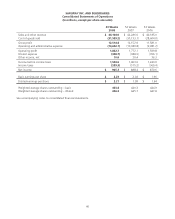
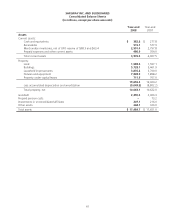
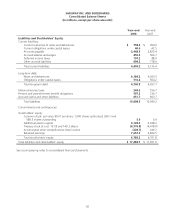
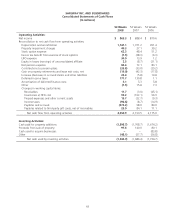
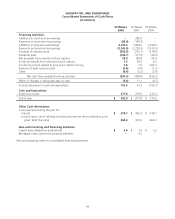
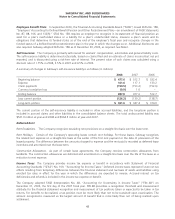
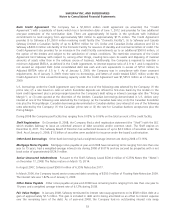
SAFEWAY INC. AND SUBSIDIARIES
Consolidated Statements of Cash Flows
(In millions)
53 Weeks
2008
52 Weeks
2007
52 Weeks
2006
Operating Activities:
Net income $ 965.3 $ 888.4 $ 870.6
Reconciliation to net cash flow from operating activities:
Depreciation and amortization 1,141.1 1,071.2 991.4
Property impairment charges 40.3 27.1 39.2
Stock option expense 62.3 48.4 51.2
Excess tax benefit from exercise of stock options (1.5) (38.3) (6.3)
LIFO expense 34.9 13.9 1.2
Equity in losses (earnings) of unconsolidated affiliate 2.5 (8.7) (21.1)
Net pension expense 84.6 72.1 83.1
Contributions to pension plans (33.8) (33.0) (29.2)
Gain on property retirements and lease exit costs, net (19.0) (42.3) (17.8)
Increase (decrease) in accrued claims and other liabilities 24.4 (5.8) 10.8
Deferred income taxes 171.7 130.8 1.1
Amortization of deferred finance costs 5.1 5.3 5.8
Other (1.5) 15.8 7.3
Changes in working capital items:
Receivables 11.7 (3.0) (45.1)
Inventories at FIFO cost 95.2 (102.1) 96.9
Prepaid expenses and other current assets 13.7 (22.7) (9.3)
Income taxes (96.8) (8.7) (14.9)
Payables and accruals (273.2) 98.0 89.0
Payables related to third-party gift cards, net of receivables 23.9 84.1 71.1
Net cash flow from operating activities 2,250.9 2,190.5 2,175.0
Investing Activities:
Cash paid for property additions (1,595.7) (1,768.7) (1,674.2)
Proceeds from sale of property 97.8 140.0 80.1
Cash used to acquire businesses –– (83.8)
Other (48.1) (57.7) (56.8)
Net cash used by investing activities (1,546.0) (1,686.4) (1,734.7)
43