Safeway 2008 Annual Report Download - page 74
Download and view the complete annual report
Please find page 74 of the 2008 Safeway annual report below. You can navigate through the pages in the report by either clicking on the pages listed below, or by using the keyword search tool below to find specific information within the annual report.-
 1
1 -
2
-
3
-
4
-
5
-
6
-
7
-
8
-
9
-
10
-
11
-
12
-
13
-
14
-
15
-
16
-
17
-
18
-
19
-
20
-
21
-
22
-
23
-
24
-
25
-
26
-
27
-
28
-
29
-
30
-
31
-
32
-
33
-
34
-
35
-
36
-
37
-
38
-
39
-
40
-
41
-
42
-
43
-
44
-
45
-
46
-
47
-
48
-
49
-
50
-
51
-
52
-
53
-
54
-
55
-
56
-
57
-
58
-
59
-
60
-
61
-
62
-
63
-
 64
64 -
 65
65 -
 66
66 -
 67
67 -
 68
68 -
 69
69 -
 70
70 -
 71
71 -
 72
72 -
 73
73 -
 74
74 -
 75
75 -
 76
76 -
 77
77 -
 78
78 -
 79
79 -
 80
80 -
 81
81 -
 82
82 -
 83
83 -
 84
84 -
85
-
86
-
87
-
88
-
89
-
90
-
91
-
92
-
93
-
94
-
95
-
96
-
97
-
98
-
99
-
100
-
101
-
102
-
103
-
104
 |
 |

SAFEWAY INC. AND SUBSIDIARIES
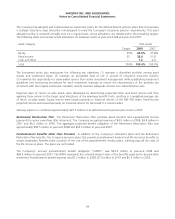
Notes to Consolidated Financial Statements
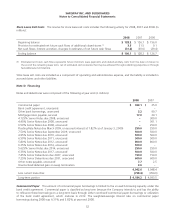
agreements.
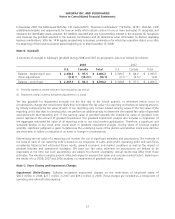
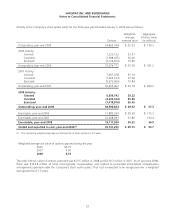
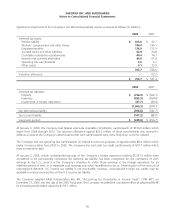
Annual Debt Maturities As of year-end 2008, annual debt maturities were as follows (in millions):
2009 $ 758.4
2010 505.7
2011 502.4
2012 1,163.0
2013 0.8
Thereafter 2,012.3
$ 4,942.6
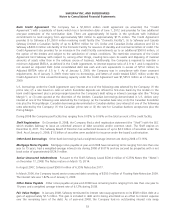
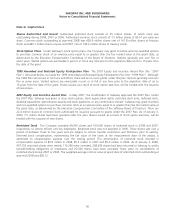
Letters of Credit The Company had letters of credit of $49.2 million outstanding at year-end 2008, of which
$34.5 million were issued under the Credit Agreement. The letters of credit are maintained primarily to support
performance, payment, deposit or surety obligations of the Company. The Company pays commissions ranging from
0.15% to 1.00% on the face amount of the letters of credit.
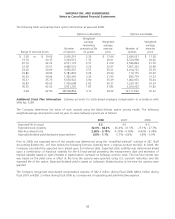
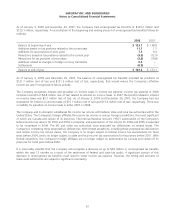
Note E: Lease Obligations
At year-end 2008, Safeway leased approximately 59% of its stores. Most leases have renewal options, typically with
increased rental rates during the option period. Certain of these leases contain options to purchase the property at
amounts that approximate fair market value.
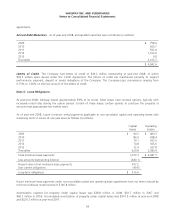
As of year-end 2008, future minimum rental payments applicable to non-cancelable capital and operating leases with
remaining terms in excess of one year were as follows (in millions):
Capital
leases
Operating
Leases
2009 $ 94.3 $ 469.3
2010 86.9 438.4
2011 79.1 397.0
2012 74.8 365.6
2013 72.4 327.8
Thereafter 629.8 2,383.4
Total minimum lease payments 1,037.3 $ 4,381.5
Less amounts representing interest (480.1)
Present value of net minimum lease payments 557.2
Less current obligations (40.6)
Long-term obligations $ 516.6
Future minimum lease payments under non-cancelable capital and operating lease agreements have not been reduced by
minimum sublease rental income of $146.8 million.
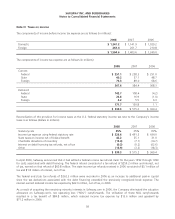
Amortization expense for property under capital leases was $38.8 million in 2008, $41.7 million in 2007 and
$42.7 million in 2006. Accumulated amortization of property under capital leases was $316.9 million at year-end 2008
and $320.2 million at year-end 2007.
54