Safeway 2008 Annual Report Download - page 60
Download and view the complete annual report
Please find page 60 of the 2008 Safeway annual report below. You can navigate through the pages in the report by either clicking on the pages listed below, or by using the keyword search tool below to find specific information within the annual report.-
 1
1 -
2
-
3
-
4
-
5
-
6
-
7
-
8
-
9
-
10
-
11
-
12
-
13
-
14
-
15
-
16
-
17
-
18
-
19
-
20
-
21
-
22
-
23
-
24
-
25
-
26
-
27
-
28
-
29
-
30
-
31
-
32
-
33
-
34
-
35
-
36
-
37
-
38
-
39
-
40
-
41
-
42
-
43
-
44
-
45
-
46
-
47
-
48
-
49
-
 50
50 -
 51
51 -
 52
52 -
 53
53 -
 54
54 -
 55
55 -
 56
56 -
 57
57 -
 58
58 -
 59
59 -
 60
60 -
 61
61 -
 62
62 -
 63
63 -
 64
64 -
 65
65 -
 66
66 -
 67
67 -
 68
68 -
 69
69 -
 70
70 -
71
-
72
-
73
-
74
-
75
-
76
-
77
-
78
-
79
-
80
-
81
-
82
-
83
-
84
-
85
-
86
-
87
-
88
-
89
-
90
-
91
-
92
-
93
-
94
-
95
-
96
-
97
-
98
-
99
-
100
-
101
-
102
-
103
-
104
 |
 |

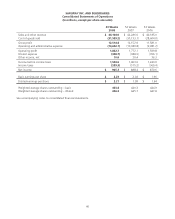
SAFEWAY INC. AND SUBSIDIARIES
Consolidated Statements of Operations
(In millions, except per-share amounts)
53 Weeks
2008
52 Weeks
2007
52 Weeks
2006
Sales and other revenue $ 44,104.0 $ 42,286.0 $ 40,185.0
Cost of goods sold (31,589.2) (30,133.1) (28,604.0)
Gross profit 12,514.8 12,152.9 11,581.0
Operating and administrative expense (10,662.1) (10,380.8) (9,981.2)
Operating profit 1,852.7 1,772.1 1,599.8
Interest expense (358.7) (388.9) (396.1)
Other income, net 10.6 20.4 36.3
Income before income taxes 1,504.6 1,403.6 1,240.0
Income taxes (539.3) (515.2) (369.4)
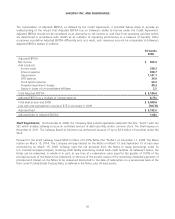
Net income $ 965.3 $ 888.4 $ 870.6
Basic earnings per share $ 2.23 $ 2.02 $ 1.96
Diluted earnings per share $ 2.21 $ 1.99 $ 1.94
Weighted average shares outstanding – basic 433.8 440.3 444.9
Weighted average shares outstanding – diluted 436.3 445.7 447.8
See accompanying notes to consolidated financial statements.
40