Safeway 2008 Annual Report Download - page 4
Download and view the complete annual report
Please find page 4 of the 2008 Safeway annual report below. You can navigate through the pages in the report by either clicking on the pages listed below, or by using the keyword search tool below to find specific information within the annual report.-
 1
1 -
 2
2 -
 3
3 -
 4
4 -
 5
5 -
 6
6 -
 7
7 -
 8
8 -
 9
9 -
 10
10 -
 11
11 -
 12
12 -
 13
13 -
 14
14 -
 15
15 -
16
-
17
-
18
-
19
-
20
-
21
-
22
-
23
-
24
-
25
-
26
-
27
-
28
-
29
-
30
-
31
-
32
-
33
-
34
-
35
-
36
-
37
-
38
-
39
-
40
-
41
-
42
-
43
-
44
-
45
-
46
-
47
-
48
-
49
-
50
-
51
-
52
-
53
-
54
-
55
-
56
-
57
-
58
-
59
-
60
-
61
-
62
-
63
-
64
-
65
-
66
-
67
-
68
-
69
-
70
-
71
-
72
-
73
-
74
-
75
-
76
-
77
-
78
-
79
-
80
-
81
-
82
-
83
-
84
-
85
-
86
-
87
-
88
-
89
-
90
-
91
-
92
-
93
-
94
-
95
-
96
-
97
-
98
-
99
-
100
-
101
-
102
-
103
-
104
 |
 |
SAFEWAY INC. 2008 ANNUAL REPORT — PAGE TWO
Dear Stockholders,
I am pleased to report that in 2008 we achieved
another year of strong earnings growth and
produced positive sales growth each quarter and
for the year. While the economic environment was
difficult, and our sales growth was lower than we
expected, we focused on our customers’ changing
needs and continued to execute well on our cost
savings initiatives.
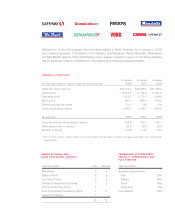
Our net income for the 53-week year in 2008 was
$965.3 million ($2.21 per diluted share) compared
to $888.4 million ($1.99 per diluted share) in the
52-week 2007. Total sales increased 4.3% to $44.1
billion in 2008 from $42.3 billion in 2007. Excluding
fuel, identical-store sales were up 0.8%.
During 2008, we spent $1.6 billion in capital
investments and completed 20 new Lifestyle stores
and 232 Lifestyle remodels, bringing our total
Lifestyle stores to 1,276, or 73% of our store base.
At the same time, we generated $681 million in free
cash flow from the business, an increase of 62%
from 2007. 1
Over the course of 2008, we returned $492 million
to stockholders, consisting of $132 million in
dividends and $360 million in stock repurchases.
We also lowered our debt outstanding on the
balance sheet by $155 million and maintained
strong and stable credit ratings on our debt.
Since 2003, we have been focused on a handful of
key priorities to achieve sustainable growth. These
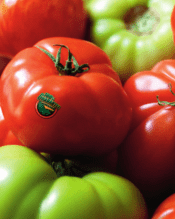
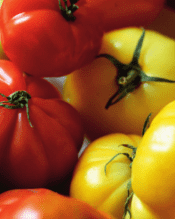
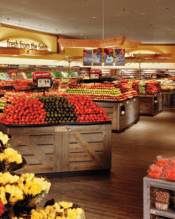
priorities include differentiating our offering from
other conventional supermarkets through quality
perishables, revitalizing the center of the store,
rolling out our Lifestyle stores and developing
new growth engines. At the same time, we have
paid close attention to cost reduction, which has
allowed us to provide more value to our customers
and narrow the price gap with discounters.
Connecting with the communities where we
operate, on social and environmental issues,
remains a key priority.
In the pages that follow, we provide you with an
update on the progress we made during 2008 in
the following areas:
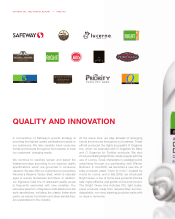
s Quality and Innovation
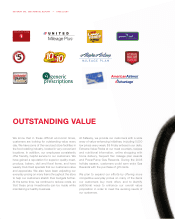
s Outstanding Value
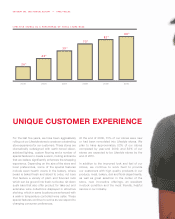
s Unique Customer Experience
s Growth Vehicles
s Social Responsibility
We continue to be encouraged about Safeway’s
future as we complete the rollout of our highly
successful Lifestyle stores, reduce our costs
and lower our everyday pricing for customers.
Our energized corporate brand portfolio is