Safeway 2008 Annual Report Download - page 3
Download and view the complete annual report
Please find page 3 of the 2008 Safeway annual report below. You can navigate through the pages in the report by either clicking on the pages listed below, or by using the keyword search tool below to find specific information within the annual report.-
 1
1 -
 2
2 -
 3
3 -
 4
4 -
 5
5 -
 6
6 -
 7
7 -
 8
8 -
 9
9 -
 10
10 -
 11
11 -
 12
12 -
 13
13 -
 14
14 -
15
-
16
-
17
-
18
-
19
-
20
-
21
-
22
-
23
-
24
-
25
-
26
-
27
-
28
-
29
-
30
-
31
-
32
-
33
-
34
-
35
-
36
-
37
-
38
-
39
-
40
-
41
-
42
-
43
-
44
-
45
-
46
-
47
-
48
-
49
-
50
-
51
-
52
-
53
-
54
-
55
-
56
-
57
-
58
-
59
-
60
-
61
-
62
-
63
-
64
-
65
-
66
-
67
-
68
-
69
-
70
-
71
-
72
-
73
-
74
-
75
-
76
-
77
-
78
-
79
-
80
-
81
-
82
-
83
-
84
-
85
-
86
-
87
-
88
-
89
-
90
-
91
-
92
-
93
-
94
-
95
-
96
-
97
-
98
-
99
-
100
-
101
-
102
-
103
-
104
 |
 |
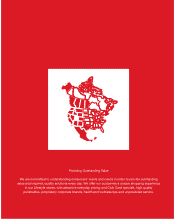
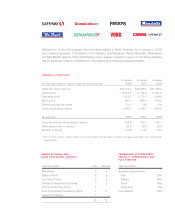
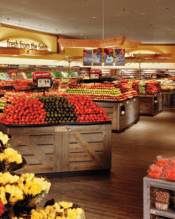
Safeway Inc. is one of the largest food and drug retailers in North America. As of January 3, 2009,
the company operated 1,739 stores in the Western, Southwestern, Rocky Mountain, Midwestern
and Mid-Atlantic regions of the United States and in western Canada. In support of its stores, Safeway
has an extensive network of distribution, manufacturing and food processing facilities.
MANUFACTURING AND
FOOD PROCESSING FACILITIES
Year-end 2008 U.S. Canada
Milk Plants 6 3
Bakery Plants 6 2
Ice Cream Plants 2 2
Cheese & Meat Packing Plants – 2
Soft Drink Bottling Plants 4 –
Fruit & Vegetable Processing Plants 1 3
Cake Commissary 1 –
20 12
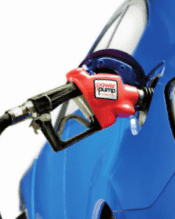
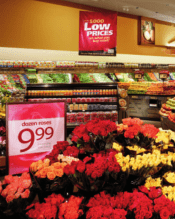
PERCENTAGE OF STORES WITH
SPECIALTY DEPARTMENTS AND
FUEL STATIONS
Year-end 2008
Specialty Departments
Deli 97%
Bakery 95%
Floral 96%
Pharmacy 77%
Fuel Stations 22%
FINANCIAL HIGHLIGHTS
For the year (dollars in millions, except per-share amounts)
53 weeks
2008
52 weeks
2007
52 weeks
2006
Sales and other revenue $ 44,104.0 $ 42,286.0 $ 40,185.0
Gross profit 12,514.8 12,152.9 11,581.0
Operating profit 1,852.7 1,772.1 1,599.8
Net income 965.3 888.4 870.6
Diluted earnings per share 2.21 1.99 1.94
Cash capital expenditures 1,595.7 1,768.7 1,674.2
At year-end 2008 2007 2006
Common shares outstanding (in millions)* 428.9 440.1 440.1
Retail square feet (in millions) 80.4 80.3 80.8
Number of stores 1,739 1,743 1,761
* Net of 161.8 million, 149.2 million and 142.4 million shares held in treasury at year-end 2008, 2007 and 2006,
respectively.