Safeway 2008 Annual Report Download - page 84
Download and view the complete annual report
Please find page 84 of the 2008 Safeway annual report below. You can navigate through the pages in the report by either clicking on the pages listed below, or by using the keyword search tool below to find specific information within the annual report.-
 1
1 -
2
-
3
-
4
-
5
-
6
-
7
-
8
-
9
-
10
-
11
-
12
-
13
-
14
-
15
-
16
-
17
-
18
-
19
-
20
-
21
-
22
-
23
-
24
-
25
-
26
-
27
-
28
-
29
-
30
-
31
-
32
-
33
-
34
-
35
-
36
-
37
-
38
-
39
-
40
-
41
-
42
-
43
-
44
-
45
-
46
-
47
-
48
-
49
-
50
-
51
-
52
-
53
-
54
-
55
-
56
-
57
-
58
-
59
-
60
-
61
-
62
-
63
-
64
-
65
-
66
-
67
-
68
-
69
-
70
-
71
-
72
-
73
-
 74
74 -
 75
75 -
 76
76 -
 77
77 -
 78
78 -
 79
79 -
 80
80 -
 81
81 -
 82
82 -
 83
83 -
 84
84 -
 85
85 -
 86
86 -
 87
87 -
 88
88 -
 89
89 -
 90
90 -
 91
91 -
 92
92 -
 93
93 -
 94
94 -
95
-
96
-
97
-
98
-
99
-
100
-
101
-
102
-
103
-
104
 |
 |

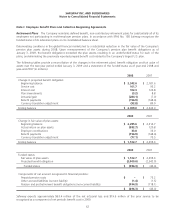
SAFEWAY INC. AND SUBSIDIARIES
Notes to Consolidated Financial Statements
The Company has adopted and implemented an investment policy for the defined benefit pension plans that incorporates
a strategic long-term asset allocation mix designed to meet the Company’s long-term pension requirements. This asset
allocation policy is reviewed annually and, on a regular basis, actual allocations are rebalanced to the prevailing targets.
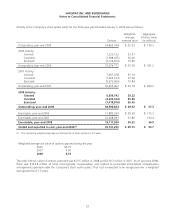
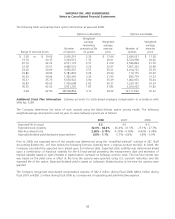
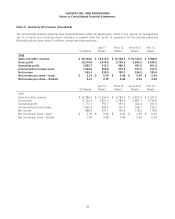
The following table summarizes actual allocations for Safeway’s plans at year-end 2008 and year-end 2007:
Asset category Plan assets
Target 2008 2007
Equity 65% 60.8% 67.8%
Fixed income 35 38.0 31.8
Cash and other – 1.2 0.4
Total 100% 100.0% 100.0%
The investment policy also emphasizes the following key objectives: (1) maintain a diversified portfolio among asset
classes and investment styles; (2) maintain an acceptable level of risk in pursuit of long-term economic benefit;
(3) maximize the opportunity for value-added returns from active investment management while establishing investment
guidelines and monitoring procedures for each investment manager to ensure the characteristics of the portfolio are
consistent with the original investment mandate; and (4) maintain adequate controls over administrative costs.
Expected rates of return on plan assets were developed by determining projected stock and bond returns and then
applying these returns to the target asset allocations of the employee benefit trusts, resulting in a weighted-average rate
of return on plan assets. Equity returns were based primarily on historical returns of the S&P 500 Index. Fixed-income
projected returns were based primarily on historical returns for the broad U.S. bond market.
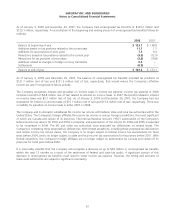
Safeway expects to contribute approximately $25.9 million to its defined benefit pension plan trusts in 2009.
Retirement Restoration Plan The Retirement Restoration Plan provides death benefits and supplemental income
payments for senior executives after retirement. The Company recognized expense of $4.9 million in 2008, $4.8 million in
2007 and $5.2 million in 2006. The aggregate projected benefit obligation of the Retirement Restoration Plan was
approximately $58.5 million at year-end 2008 and $62.9 million at year-end 2007.
Postretirement Benefits other than Pensions In addition to the Company’s retirement plans and the Retirement
Restoration Plan benefits, the Company sponsors plans that provide postretirement medical and life insurance benefits to
certain employees. Retirees share a portion of the cost of the postretirement medical plans. Safeway pays all the costs of
the life insurance plans. The plans are not funded.
The Company’s accrued postretirement benefit obligation (“APBO”) was $52.6 million at year-end 2008 and
$64.6 million at year-end 2007. The APBO represents the actuarial present value of the benefits expected to be paid after
retirement. Postretirement benefit expense was $7.2 million in 2008, $7.6 million in 2007 and $5.5 million in 2006.
64