Qantas 2013 Annual Report Download - page 92
Download and view the complete annual report
Please find page 92 of the 2013 Qantas annual report below. You can navigate through the pages in the report by either clicking on the pages listed below, or by using the keyword search tool below to find specific information within the annual report.-
 1
1 -
2
-
3
-
4
-
5
-
6
-
7
-
8
-
9
-
10
-
11
-
12
-
13
-
14
-
15
-
16
-
17
-
18
-
19
-
20
-
21
-
22
-
23
-
24
-
25
-
26
-
27
-
28
-
29
-
30
-
31
-
32
-
33
-
34
-
35
-
36
-
37
-
38
-
39
-
40
-
41
-
42
-
43
-
44
-
45
-
46
-
47
-
48
-
49
-
50
-
51
-
52
-
53
-
54
-
55
-
56
-
57
-
58
-
59
-
60
-
61
-
62
-
63
-
64
-
65
-
66
-
67
-
68
-
69
-
70
-
71
-
72
-
73
-
74
-
75
-
76
-
77
-
78
-
79
-
80
-
81
-
 82
82 -
 83
83 -
 84
84 -
 85
85 -
 86
86 -
 87
87 -
 88
88 -
 89
89 -
 90
90 -
 91
91 -
 92
92 -
 93
93 -
 94
94 -
 95
95 -
 96
96 -
 97
97 -
 98
98 -
 99
99 -
 100
100 -
 101
101 -
 102
102 -
103
-
104
-
105
-
106
-
107
-
108
-
109
-
110
-
111
-
112
-
113
-
114
-
115
-
116
-
117
-
118
-
119
-
120
-
121
-
122
-
123
-
124
-
125
-
126
-
127
-
128
-
129
-
130
-
131
-
132
-
133
-
134
-
135
-
136
-
137
-
138
-
139
-
140
-
141
-
142
-
143
-
144
-
145
-
146
-
147
-
148
-
149
-
150
-
151
-
152
-
153
-
154
-
155
-
156
-
157
-
158
-
159
-
160
-
161
-
162
-
163
-
164
-
165
-
166
-
167
-
168
-
169
-
170
-
171
-
172
-
173
-
174
-
175
-
176
-
177
-
178
-
179
-
180
-
181
-
182
-
183
-
184
 |
 |
90
Directors’ Report continued
FOR THE YEAR ENDED 30 JUNE 2013
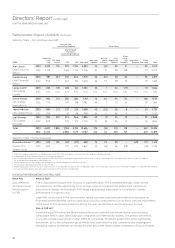
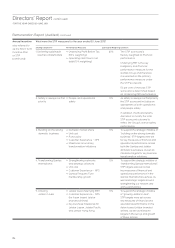
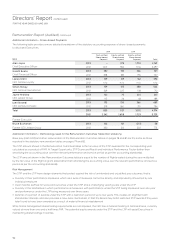
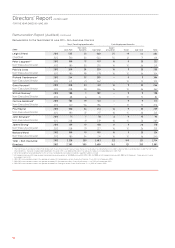
Target Remuneration Mix FAR
%
STIP
%
LTIP
%
Alan Joyce 33 40 27
Gareth Evans 43 35 22
Lesley Grant 49 39 12
Simon Hickey 43 35 22
Jayne Hrdlicka 43 35 22
Lyell Strambi 43 35 22
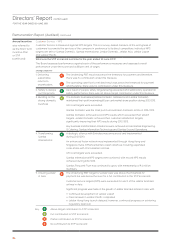
Performance-related Remuneration
FAR & Other
%
STIP
LTIPCash-based Share-based
Statutory Remuneration Mix Cash Incentives
%
Cash-settled
%
Equity-settled
%
Rights Awards
%
Alan Joyce 43 15 0 7 35
Gareth Evans 53 12 10 7 18
Lesley Grant 60 13 10 6 11
Simon Hickey 60 11 8 6 15
Jayne Hrdlicka 61 12 10 4 13
Lyell Strambi 55 11 10 6 18
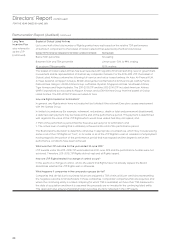
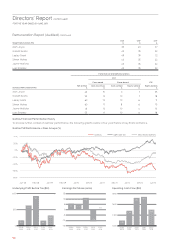
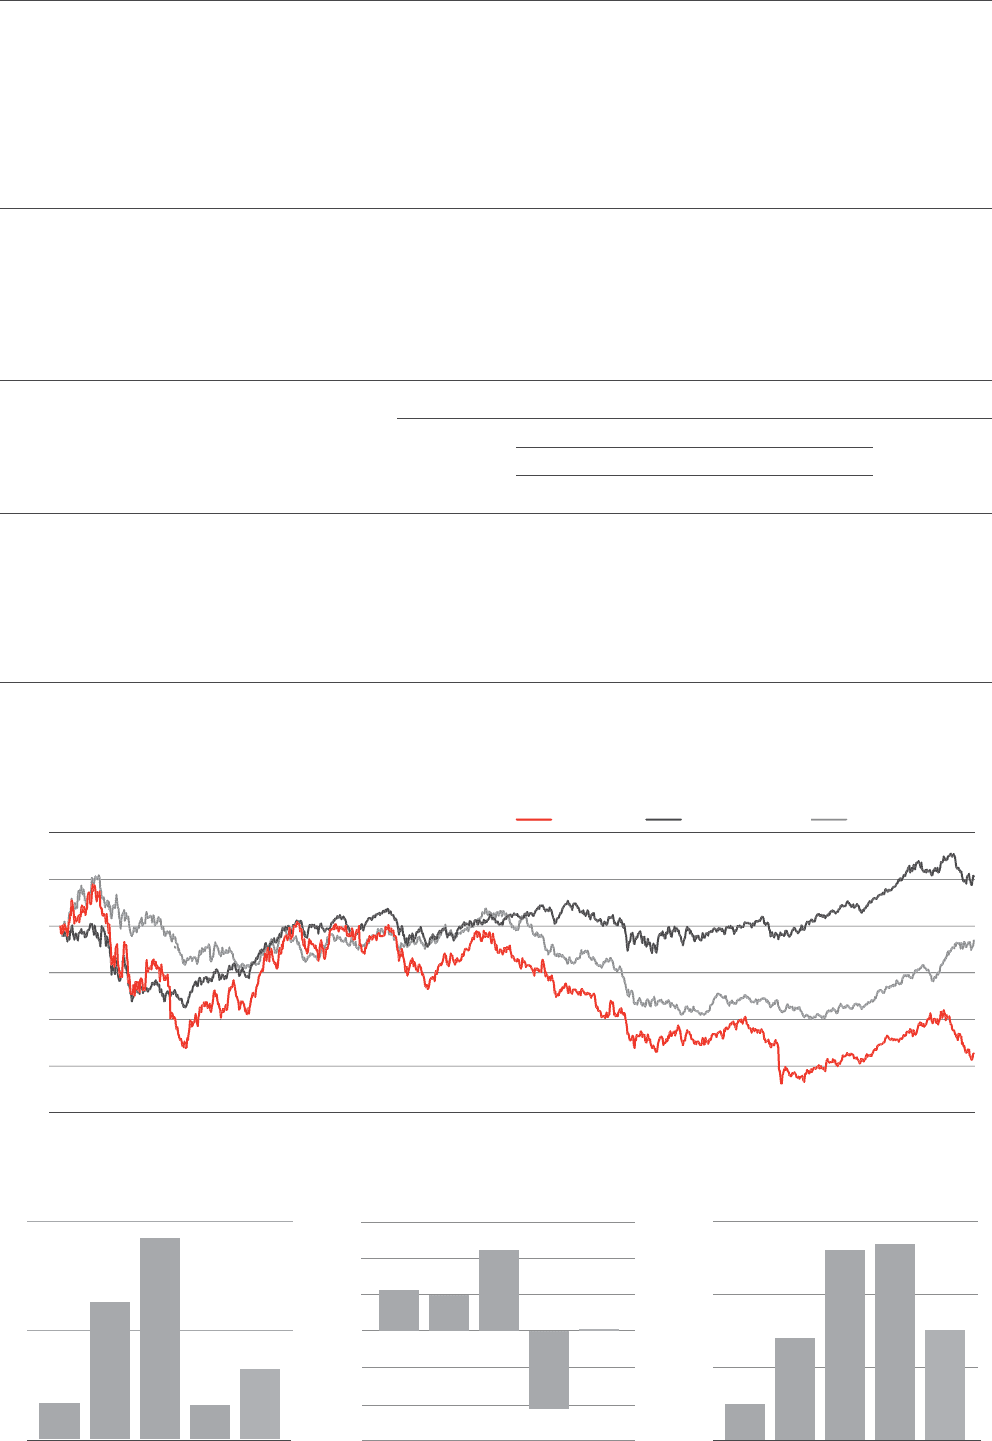
Qantas Financial Performance History
To provide further context on Qantas’ performance, the following graphs outline a ve-year history of key nancial metrics.
Qantas TSR Performance v Peer Groups (%)
-80%
%
-
60%
%
-
40%
%
-20
%
%
0
%
%
20%
%
40%
%
J
u
n
08
D
e
c
08
J
u
n
09
D
e
c
09
J
u
n
1
0
D
e
c
1
0
J
u
n
11
D
e
c
11
J
u
n
1
2
D
e
c
1
2
J
u
n
1
3
Q
anta
s
S&
P
/
A
SX
1
00
M
SCI
W
orl
d
A
i
rl
i
ne
s
0
300
600
2008/
2009 2009/
2010 2010/
2011 2011/
2012 2012/
2013
100
377
552
95
192
-15
-10
-5
0
5
10
15
2008/
2009 2009/
2010 2010/
2011 2011/
2012 2012/
2013
5.6 4.9
11.0
-10.8
0.28
1
,000
1,300
1,600
1,900
2008/
2009 2009/
2010 2010/
2011 2011/
2012 2012/
2013
1,149
1,351
1,782 1,810
1,417
Remuneration
Repor
t
(Audited)
c
ontinue
d
Underlying Prot Before Tax ($M) Earnings Per Share (cents) Operating Cash Flow ($M)