Qantas 2013 Annual Report Download - page 79
Download and view the complete annual report
Please find page 79 of the 2013 Qantas annual report below. You can navigate through the pages in the report by either clicking on the pages listed below, or by using the keyword search tool below to find specific information within the annual report.-
 1
1 -
2
-
3
-
4
-
5
-
6
-
7
-
8
-
9
-
10
-
11
-
12
-
13
-
14
-
15
-
16
-
17
-
18
-
19
-
20
-
21
-
22
-
23
-
24
-
25
-
26
-
27
-
28
-
29
-
30
-
31
-
32
-
33
-
34
-
35
-
36
-
37
-
38
-
39
-
40
-
41
-
42
-
43
-
44
-
45
-
46
-
47
-
48
-
49
-
50
-
51
-
52
-
53
-
54
-
55
-
56
-
57
-
58
-
59
-
60
-
61
-
62
-
63
-
64
-
65
-
66
-
67
-
68
-
 69
69 -
 70
70 -
 71
71 -
 72
72 -
 73
73 -
 74
74 -
 75
75 -
 76
76 -
 77
77 -
 78
78 -
 79
79 -
 80
80 -
 81
81 -
 82
82 -
 83
83 -
 84
84 -
 85
85 -
 86
86 -
 87
87 -
 88
88 -
 89
89 -
90
-
91
-
92
-
93
-
94
-
95
-
96
-
97
-
98
-
99
-
100
-
101
-
102
-
103
-
104
-
105
-
106
-
107
-
108
-
109
-
110
-
111
-
112
-
113
-
114
-
115
-
116
-
117
-
118
-
119
-
120
-
121
-
122
-
123
-
124
-
125
-
126
-
127
-
128
-
129
-
130
-
131
-
132
-
133
-
134
-
135
-
136
-
137
-
138
-
139
-
140
-
141
-
142
-
143
-
144
-
145
-
146
-
147
-
148
-
149
-
150
-
151
-
152
-
153
-
154
-
155
-
156
-
157
-
158
-
159
-
160
-
161
-
162
-
163
-
164
-
165
-
166
-
167
-
168
-
169
-
170
-
171
-
172
-
173
-
174
-
175
-
176
-
177
-
178
-
179
-
180
-
181
-
182
-
183
-
184
 |
 |

77
QANTAS ANNUAL REPORT 2013
REMUNERATION REPORT AUDITED
INTRODUCTION
OVERVIEW OF THE EXECUTIVE REMUNERATION FRAMEWORK
The objectives of the Executive Remuneration Framework are to attract, motivate, retain and appropriately reward a capable
Executive team. This is achieved by setting pay opportunity at an appropriate level and by linking remuneration outcomes to
Qantas’ performance. The Qantas Executive Remuneration Framework contains three elements:
»Base pay – referred to as Fixed Annual Remuneration (FAR)
»An annual incentive – referred to as the Short Term Incentive Plan (STIP)
»A long term incentive – referred to as the Long Term Incentive Plan (LTIP)
Base Pay
Each year, the Remuneration Committee reviews the base pay for the CEO and direct reports to the CEO (Executive Management).
Base pay is set with reference to external benchmark data against comparable roles in companies listed on the ASX and
international airlines.
A more detailed description of base pay and how it is set is provided on pages 82 to 83.
Annual Incentive
The annual incentive plan for the CEO and Executive Management at Qantas is known as the STIP.
Each year, Executives may receive an award that is a combination of a cash bonus and an award of restricted shares if the plan’s
performance conditions are achieved.
In June 2012, the Remuneration Committee reviewed the STIP, conrming that its design and structure remained appropriate and that
it will produce outcomes that are aligned to company and individual performance. The STIP is aligned to our strategic and business
priorities and reects the unique challenges that Qantas faces as a major international airline in Australia. While Underlying PBT is
the primary performance measure under the STIP (with a 50 per cent weighting), it does not operate as a “prot gate”. Qantas is
undergoing a signicant transformation agenda which is positioning Qantas for a sustainable future. This agenda is also reected
inthe STIP scorecard which contains key measures which are explicitly aligned to the execution of the Qantas Group Strategy.
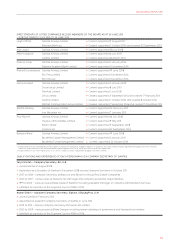
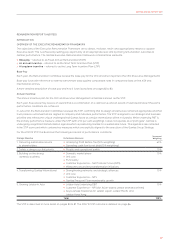
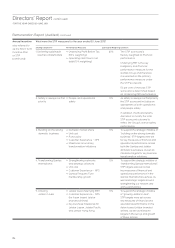
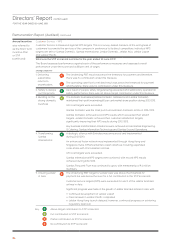
For the 2012/13 STIP, the Board set the following scorecard of performance conditions:
Strategic Objective Performance Measures Scorecard
Weighting
1. Delivering sustainable returns
toshareholders
»Underlying Prot Before Tax (50% weighting)
»Operating cash ow to net debt (10% weighting)
60%
2. Safety is always our rst priority »People and operational safety 10%
3. Building on the strong
domesticbusiness
»Domestic market share
»Unit cost
»Punctuality
»Customer Experience – Net Promoter Score (NPS)
»Milestones around key transformation initiatives
10%
4. Transforming Qantas International »Strengthening networks and strategic alliances
»Unit cost
»Customer Experience – NPS
»Qantas Frequent Flyer membership growth
10%
5. Growing Jetstar in Asia »Jetstar Asia Underlying EBIT
»Customer Experience – NPS (for Asian-based Jetstar branded airlines)
»Key business milestones for Jetstar Japan, Jetstar Pacic and
JetstarHong Kong
10%
Total 100%
The STIP is described in more detail on pages 83 to 87. The 2012/13 STIP outcome is detailed on page 86.