Qantas 2013 Annual Report Download - page 126
Download and view the complete annual report
Please find page 126 of the 2013 Qantas annual report below. You can navigate through the pages in the report by either clicking on the pages listed below, or by using the keyword search tool below to find specific information within the annual report.-
 1
1 -
2
-
3
-
4
-
5
-
6
-
7
-
8
-
9
-
10
-
11
-
12
-
13
-
14
-
15
-
16
-
17
-
18
-
19
-
20
-
21
-
22
-
23
-
24
-
25
-
26
-
27
-
28
-
29
-
30
-
31
-
32
-
33
-
34
-
35
-
36
-
37
-
38
-
39
-
40
-
41
-
42
-
43
-
44
-
45
-
46
-
47
-
48
-
49
-
50
-
51
-
52
-
53
-
54
-
55
-
56
-
57
-
58
-
59
-
60
-
61
-
62
-
63
-
64
-
65
-
66
-
67
-
68
-
69
-
70
-
71
-
72
-
73
-
74
-
75
-
76
-
77
-
78
-
79
-
80
-
81
-
82
-
83
-
84
-
85
-
86
-
87
-
88
-
89
-
90
-
91
-
92
-
93
-
94
-
95
-
96
-
97
-
98
-
99
-
100
-
101
-
102
-
103
-
104
-
105
-
106
-
107
-
108
-
109
-
110
-
111
-
112
-
113
-
114
-
115
-
 116
116 -
 117
117 -
 118
118 -
 119
119 -
 120
120 -
 121
121 -
 122
122 -
 123
123 -
 124
124 -
 125
125 -
 126
126 -
 127
127 -
 128
128 -
 129
129 -
 130
130 -
 131
131 -
 132
132 -
 133
133 -
 134
134 -
 135
135 -
 136
136 -
137
-
138
-
139
-
140
-
141
-
142
-
143
-
144
-
145
-
146
-
147
-
148
-
149
-
150
-
151
-
152
-
153
-
154
-
155
-
156
-
157
-
158
-
159
-
160
-
161
-
162
-
163
-
164
-
165
-
166
-
167
-
168
-
169
-
170
-
171
-
172
-
173
-
174
-
175
-
176
-
177
-
178
-
179
-
180
-
181
-
182
-
183
-
184
 |
 |
124
Qantas Group
2013
$M
2012
$M
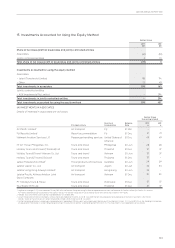
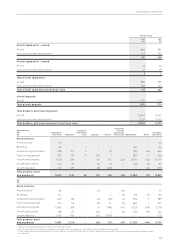
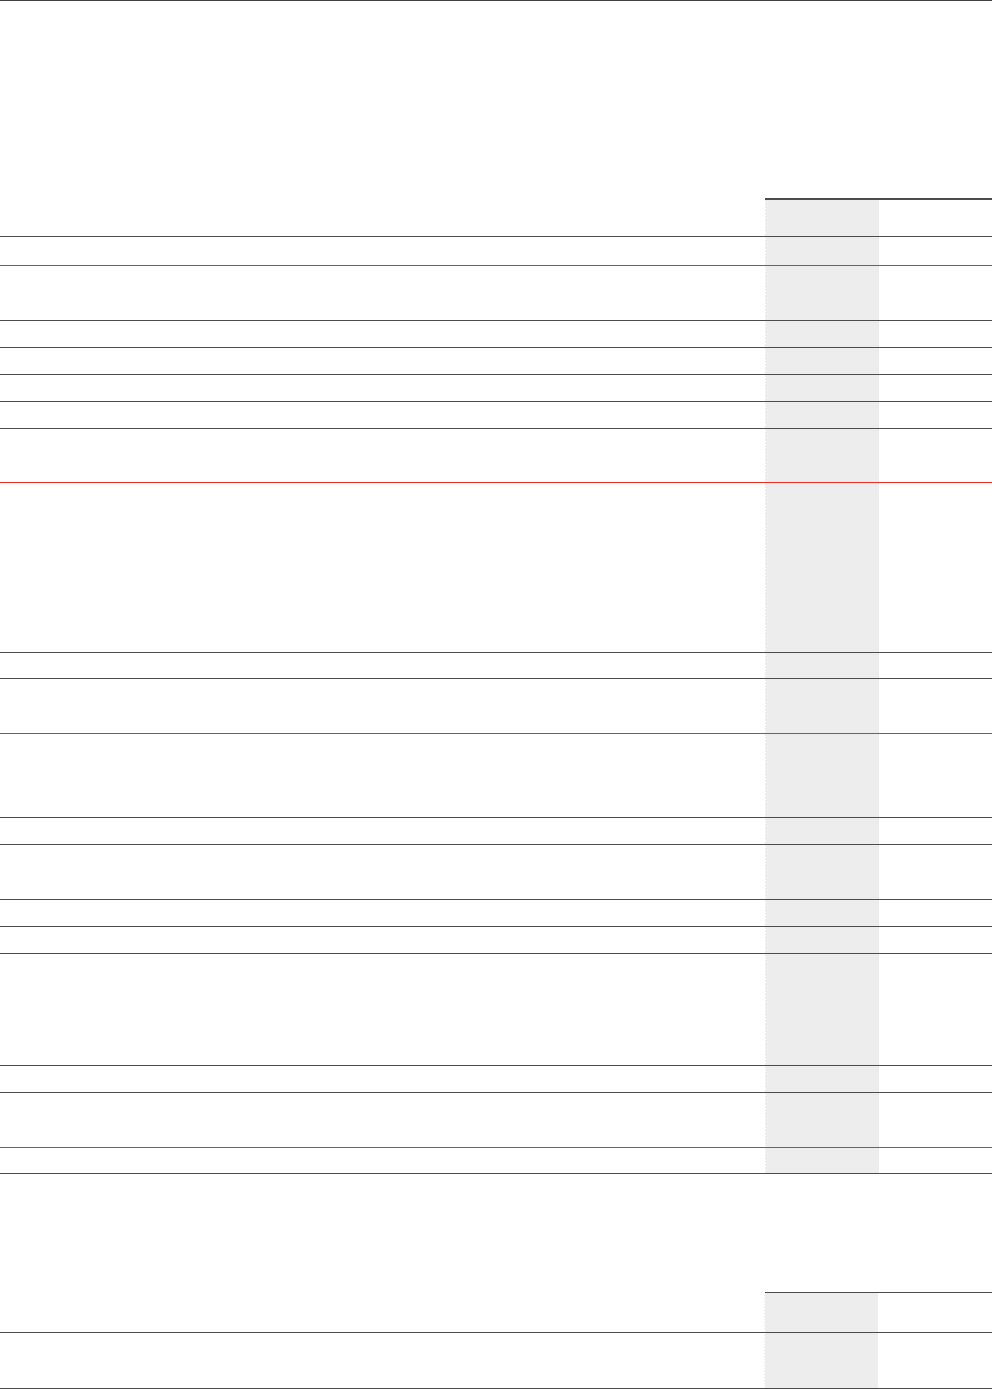
RESULTS OF ASSOCIATES
Revenues 592 597
Expenditure (687) (611)
Loss before income tax expense (95) (14)
Income tax expense (9) (10)
Net (loss)/prot of associates (104) (24)
Qantas Group’s share of net (loss)/prot of associates (41) (10)
MOVEMENTS IN CARRYING AMOUNT OF INVESTMENTS IN ASSOCIATES
Carrying amount of investments in associates as at 1 July 163 165
Additional investment in associates 73 32
Share of net loss of associates (41) (10)
Dividends received from associates (4) (8)
Transfer to external investments –(20)
Share of foreign currency translation reserve movements (1) 4
Carrying amount of investments in associates as at 30 June 190 163
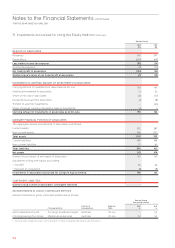
SUMMARY FINANCIAL POSITION OF ASSOCIATES
The aggregate assets and liabilities of associates is as follows:
Current assets 525 387
Non-current assets 582 552
Total assets 1,107 939
Current liabilities 489 396
Non-current liabilities 57 65
Total liabilities 546 461
Net assets 561 478
Qantas Group’s share of net assets of associates 162 135
Adjustment arising from equity accounting
– Goodwill 36 36
– Discount on acquisition (8) (8)
Investments in associates accounted for using the equity method 190 163
CONTINGENT LIABILITIES
Qantas Group’s share of associates’ contingent liabilities ––
B INVESTMENTS IN JOINTLY CONTROLLED ENTITIES
Details of interests in jointly controlled entities are as follows:
Qantas Group
Ownership Interest
Principal Activity
Country of
Incorporation
Balance
Date 2013
%
2012
%
AUX Investments Pty Ltd1Air Cargo and Road Freight Australia 30 Jun –50
LTQ Engineering Pty Limited Maintenance services Australia 30 Jun 50 50
1 The Group sold its 50 per cent share in AUX Investments Pty Ltd on 13 November 2012. Refer to note 28 for details.
15. Investments Accounted for Using the Equity Method
continue
d
Notes to the Financial Statements continued
FOR THE YEAR ENDED 30 JUNE 2013