Qantas 2013 Annual Report Download - page 83
Download and view the complete annual report
Please find page 83 of the 2013 Qantas annual report below. You can navigate through the pages in the report by either clicking on the pages listed below, or by using the keyword search tool below to find specific information within the annual report.-
 1
1 -
2
-
3
-
4
-
5
-
6
-
7
-
8
-
9
-
10
-
11
-
12
-
13
-
14
-
15
-
16
-
17
-
18
-
19
-
20
-
21
-
22
-
23
-
24
-
25
-
26
-
27
-
28
-
29
-
30
-
31
-
32
-
33
-
34
-
35
-
36
-
37
-
38
-
39
-
40
-
41
-
42
-
43
-
44
-
45
-
46
-
47
-
48
-
49
-
50
-
51
-
52
-
53
-
54
-
55
-
56
-
57
-
58
-
59
-
60
-
61
-
62
-
63
-
64
-
65
-
66
-
67
-
68
-
69
-
70
-
71
-
72
-
 73
73 -
 74
74 -
 75
75 -
 76
76 -
 77
77 -
 78
78 -
 79
79 -
 80
80 -
 81
81 -
 82
82 -
 83
83 -
 84
84 -
 85
85 -
 86
86 -
 87
87 -
 88
88 -
 89
89 -
 90
90 -
 91
91 -
 92
92 -
 93
93 -
94
-
95
-
96
-
97
-
98
-
99
-
100
-
101
-
102
-
103
-
104
-
105
-
106
-
107
-
108
-
109
-
110
-
111
-
112
-
113
-
114
-
115
-
116
-
117
-
118
-
119
-
120
-
121
-
122
-
123
-
124
-
125
-
126
-
127
-
128
-
129
-
130
-
131
-
132
-
133
-
134
-
135
-
136
-
137
-
138
-
139
-
140
-
141
-
142
-
143
-
144
-
145
-
146
-
147
-
148
-
149
-
150
-
151
-
152
-
153
-
154
-
155
-
156
-
157
-
158
-
159
-
160
-
161
-
162
-
163
-
164
-
165
-
166
-
167
-
168
-
169
-
170
-
171
-
172
-
173
-
174
-
175
-
176
-
177
-
178
-
179
-
180
-
181
-
182
-
183
-
184
 |
 |
81
QANTAS ANNUAL REPORT 2013
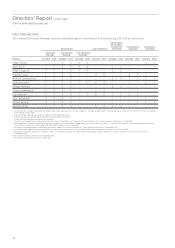
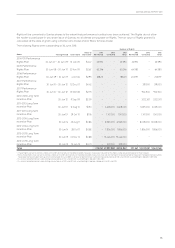
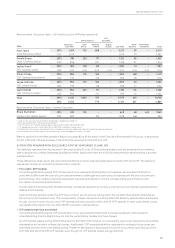
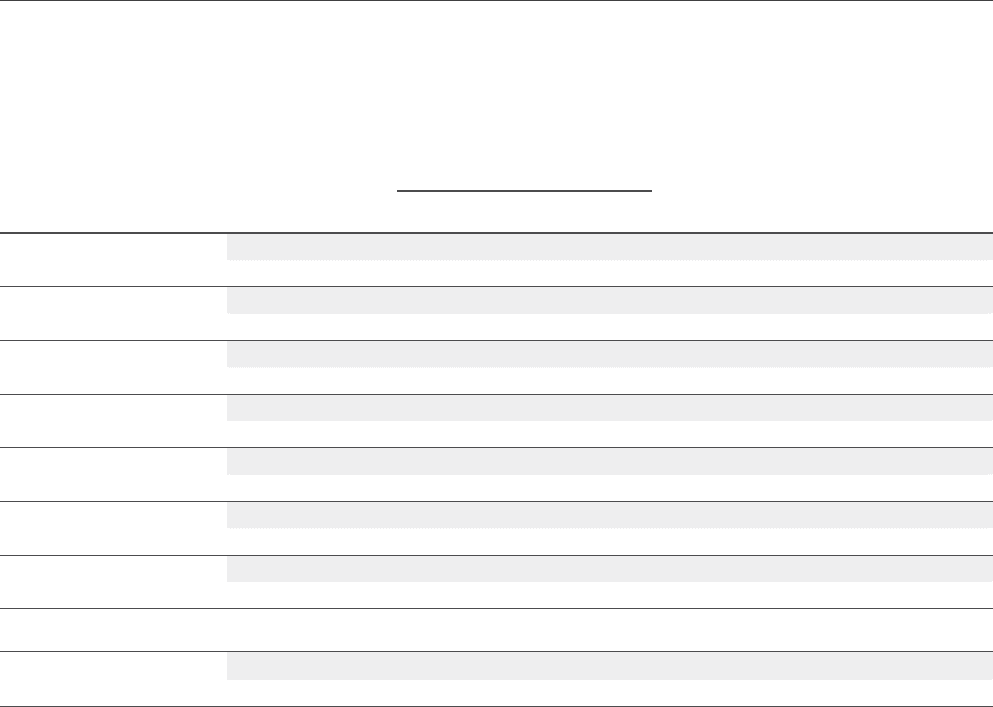
Remuneration Outcomes Table – CEO and Executive KMP (Non-statutory)1
$’000 Base Pay –
Cash FAR2
STIP Outcomes3
LTIP
Outcomes4
Sub-total
Other
Benets5
Termination
Payments Total
Cash
Bonus
Deferred
Award
Rights
Vested
Alan Joyce
Chief Executive Ofcer
2013 2,109 775 388 – 3,272 59 – 3,331
2012 2,109 – – – 2,109 171 – 2,280
Gareth Evans
Chief Financial Ofcer
2013 981 233 117 – 1,331 96 – 1,427
2012 906 – 220 – 1,126 117 – 1,243
Lesley Grant6
CEO Qantas Loyalty
2013 785 178 89 – 1,052 51 – 1,103
2012 n/a n/a n/a n/a n/a n/a n/a n/a
Simon Hickey
CEO Qantas International
2013 984 213 106 – 1,303 168 – 1,471
2012 770 – 173 – 943 131 – 1,074
Jayne Hrdlicka
CEO Jetstar Group
2013 984 213 106 – 1,303 63 – 1,366
2012 759 – 176 – 935 77 – 1,012
Lyell Strambi
CEO Qantas Domestic
2013 984 223 111 – 1,318 112 – 1,430
2012 909 – 210 – 1,119 141 – 1,260
Total 2013 6,827 1,835 917 – 9,579 549 – 10,128
2012 5,453 – 779 – 6,232 637 – 6,869
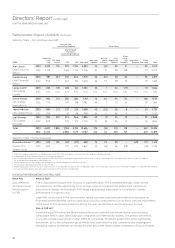
Remuneration Outcomes Table – Former Executive
Bruce Buchanan 2013 493 155 – – 648 68 649 1,365
Former CEO Jetstar Group 2012 849 – 159 – 1,008 (46) – 962
1 Detail of non-statutory remuneration methodology is explained on page 92.
2 Base pay, paid to each Executive during the year.
3 The full value of STIP awards made to each Executive during 2012/2013 and 2011/2012.
4 LTIP awards did not vest in either 2012/2013 or 2011/2012, therefore nil value shown.
5 Other Benets include non-cash benets, annual leave accrual, post-employment benets and other long-term benets.
6 Remuneration for Ms Grant reects her commencing in a key management role on 1 July 2012.
Refer to section 6 of the Remuneration Report on pages 82 to 90 for detail of the Executive Remuneration Structure, a description
ofFAR, STIP and LTIP and analysis of the 2012/2013 outcomes for the STIP and LTIP.
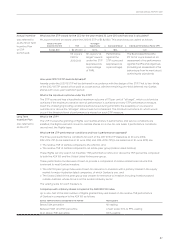
5 STATUTORY REMUNERATION DISCLOSURES FOR THE YEAR ENDED 30 JUNE 2013
The statutory remuneration disclosures for the year ended 30 June 2013 are detailed below and are prepared in accordance
with Australian Accounting Standards (AASBs) and differ signicantly from the 2012/2013 remuneration decisions and outcomes
outlinedabove.
These differences arise due to the accounting treatment of share-based payments (such as the STIP and LTIP). The statutory
disclosures include an accounting remuneration value for:
»Prior years’ STIP awards
Accounting standards require STIP remuneration to be expensed (and therefore included as remuneration) in nancial
years which differ from the year of scorecard performance (although any cash bonus is expensed in the year of scorecard
performance). This creates a disconnect between reported remuneration and the corresponding years’ nancial and
non-nancial scorecard performance.
In both 2010/2011 and 2011/2012, the Board made considered decisions to not pay a cash bonus and instead awarded entirely
deferred STIP awards.
Deferred shares granted under the STIP have a future service period, during which the recipient must remain employed by
theGroup for the awards to vest. The consequence of these decisions is that the 2012/2013 statutory remuneration disclosures
include a value
for part of prior year STIP awards and only a portion of the 2012/13 STIP awards. In most cases these values
aresignicantly higher than the 2012/13 STIP outcomes outlined above.
»LTIP awards that have not vested
Accounting standards require LTIP remuneration to be expensed (and therefore included as statutory remuneration)
notwithstanding that the Rights have not met the performance hurdles and have lapsed.
No LTIP awards vested during 2012/2013 (under the 2011-2013 LTIP), however, an accounting value is still required by accounting
standards to be included in these disclosures. Additionally, LTIP awards that will be assessed for vesting in future years are
expensed over the three year testing period. Therefore, the statutory disclosures include an accounting value for part of the
2012–2014 and the 2013–2015 LTIP awards, even though no LTIP awards vested during 2012/2013.