Qantas 2013 Annual Report Download - page 62
Download and view the complete annual report
Please find page 62 of the 2013 Qantas annual report below. You can navigate through the pages in the report by either clicking on the pages listed below, or by using the keyword search tool below to find specific information within the annual report.-
 1
1 -
2
-
3
-
4
-
5
-
6
-
7
-
8
-
9
-
10
-
11
-
12
-
13
-
14
-
15
-
16
-
17
-
18
-
19
-
20
-
21
-
22
-
23
-
24
-
25
-
26
-
27
-
28
-
29
-
30
-
31
-
32
-
33
-
34
-
35
-
36
-
37
-
38
-
39
-
40
-
41
-
42
-
43
-
44
-
45
-
46
-
47
-
48
-
49
-
50
-
51
-
 52
52 -
 53
53 -
 54
54 -
 55
55 -
 56
56 -
 57
57 -
 58
58 -
 59
59 -
 60
60 -
 61
61 -
 62
62 -
 63
63 -
 64
64 -
 65
65 -
 66
66 -
 67
67 -
 68
68 -
 69
69 -
 70
70 -
 71
71 -
 72
72 -
73
-
74
-
75
-
76
-
77
-
78
-
79
-
80
-
81
-
82
-
83
-
84
-
85
-
86
-
87
-
88
-
89
-
90
-
91
-
92
-
93
-
94
-
95
-
96
-
97
-
98
-
99
-
100
-
101
-
102
-
103
-
104
-
105
-
106
-
107
-
108
-
109
-
110
-
111
-
112
-
113
-
114
-
115
-
116
-
117
-
118
-
119
-
120
-
121
-
122
-
123
-
124
-
125
-
126
-
127
-
128
-
129
-
130
-
131
-
132
-
133
-
134
-
135
-
136
-
137
-
138
-
139
-
140
-
141
-
142
-
143
-
144
-
145
-
146
-
147
-
148
-
149
-
150
-
151
-
152
-
153
-
154
-
155
-
156
-
157
-
158
-
159
-
160
-
161
-
162
-
163
-
164
-
165
-
166
-
167
-
168
-
169
-
170
-
171
-
172
-
173
-
174
-
175
-
176
-
177
-
178
-
179
-
180
-
181
-
182
-
183
-
184
 |
 |

60
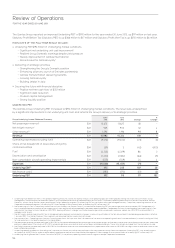
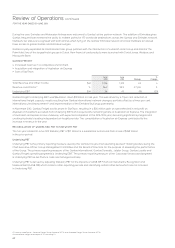
Qantas Domestic’s comparable unit cost31 improved three per cent on last year. Cost savings included transformation benets
associated with the consolidation of the Tullamarine Heavy Maintenance base into the Brisbane facility, consolidation of
engineering support functions, improved eet economics, rationalisation of catering facilities and other program initiatives.
Domestic customer satisfaction and advocacy is at its highest consistent levels and the net promoter score is at its highest level
since recording commenced in August 2008. Qantas Domestic was recognised through a number of industry awards:
»‘Best Domestic Airline’32 four years running
»‘Regional Airline of the Year’33
»‘Best Regional Airline’34
»‘Best Australian Lounges’35
Qantas has achieved superior on time performance for the last four years36.
Qantas strengthened its customer proposition through investing in a number of customer product enhancements in the year. This
included the expansion of in-seat entertainment across the domestic network37 and completion of the B767-300 eet refurbishment,
including Q-Streaming in-ight entertainment.
Qantas continues to be the clear choice for business travellers and has maintained its corporate market revenue share.
Qantas continues to support the regional market position through QantasLink and Network Aviation services securing signicant
corporate charter contracts in the year. QantasLink took delivery of three Bombardier Q400 aircraft during the year and announced
a further three Bombardier Q400 and ve leased B717-200 aircraft to join the network from the second half of 2013.
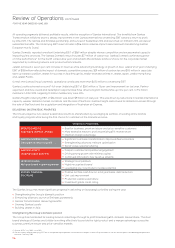
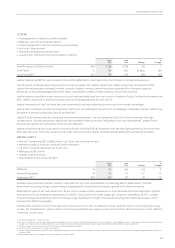
QANTAS INTERNATIONAL
»Steady improvement in Underlying EBIT
»Qantas Transformation initiatives delivering unit cost improvements
»Successful launch of the Qantas Emirates partnership providing a substantially enhanced customer offering
»Highest customer satisfaction on record38
June
2013
June
2012 Change
%
Change
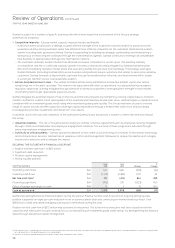
Total Revenue and Other Income $M 5,496 5,770 (274) (5)
Revenue Seat Factor %81.682.1 (0.5) pts (1)
Underlying EBIT $M (246) (484) 238 49
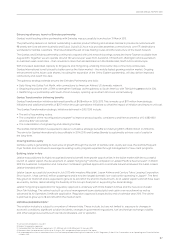
Qantas International Underlying EBIT loss of $(246) million for the year represents a $238 million (or 49 per cent) improvement
ontheprior year.
The improved result reects ongoing transformation benets. Cost saving initiatives include the consolidation of heavy maintenance
facilities and the exit of loss making routes (including the Singapore to Frankfurt service) which enabled retirement of older B747-400
aircraft. These combined benets have delivered a comparable unit cost39 improvement of ve per cent compared to prior year.
Productivity and cost benets have more than offset the impact that increased competition has had on industry wide fares.
International market capacity in and out of Australia grew by ve per cent40 during the year.
Signicant improvement to Qantas’ international product resulted in increased customer advocacy and record customer
satisfaction38. A range of business inight customer enhancements were introduced, including the sleeper service, a new menu
offering and select on Q-Eat. The launch of the Qantas Emirates partnership coincided with the roll out of chauffeur driveand
Dubai connect. The completion of the B747-400 reconguration program has also ensured that customer satisfaction on
these services is on par with the A380-800 product. The new Singapore premium lounge was opened, offering an enhanced
customerexperience.
Review of Operations continued
FOR THE YEAR ENDED 30 JUNE 2013
31 Comparable Unit Cost–net Underlying Unit Cost adjusted for the impact of Industrial Action (2011/2012), Boeing settlement, change in estimate of passenger revenue received in advance
(2012/2013), carbon tax (2012/2013) and movements in average sector length.
32 Australian Federation of Travel Agents National Industry Awards 2010-2013.
33 Air Transport World Awards 2012.
34 Australian Traveller Magazine Awards 2012.
35 Australian Business Traveller Magazine Awards 2012.
36 BITRE July 2010 to June 2013.
37 Twenty B737-800 aircraft delivered by 30 June 2013 including in-seat entertainment. Available on selected routes.
38 Annual average calendar year customer satisfaction. Qantas started recording customer satisfaction in 2003.
39 Comparable unit cost – Net Underlying Unit Cost adjusted for the impact of Industrial Action (2011/2012) and Boeing settlement (2012/2013), change in estimate of passenger
revenuereceived in advance (2012/2013) and movements in average sector length.
40 BITRE July 2012 to June 2013.