Qantas 2013 Annual Report Download - page 145
Download and view the complete annual report
Please find page 145 of the 2013 Qantas annual report below. You can navigate through the pages in the report by either clicking on the pages listed below, or by using the keyword search tool below to find specific information within the annual report.-
 1
1 -
2
-
3
-
4
-
5
-
6
-
7
-
8
-
9
-
10
-
11
-
12
-
13
-
14
-
15
-
16
-
17
-
18
-
19
-
20
-
21
-
22
-
23
-
24
-
25
-
26
-
27
-
28
-
29
-
30
-
31
-
32
-
33
-
34
-
35
-
36
-
37
-
38
-
39
-
40
-
41
-
42
-
43
-
44
-
45
-
46
-
47
-
48
-
49
-
50
-
51
-
52
-
53
-
54
-
55
-
56
-
57
-
58
-
59
-
60
-
61
-
62
-
63
-
64
-
65
-
66
-
67
-
68
-
69
-
70
-
71
-
72
-
73
-
74
-
75
-
76
-
77
-
78
-
79
-
80
-
81
-
82
-
83
-
84
-
85
-
86
-
87
-
88
-
89
-
90
-
91
-
92
-
93
-
94
-
95
-
96
-
97
-
98
-
99
-
100
-
101
-
102
-
103
-
104
-
105
-
106
-
107
-
108
-
109
-
110
-
111
-
112
-
113
-
114
-
115
-
116
-
117
-
118
-
119
-
120
-
121
-
122
-
123
-
124
-
125
-
126
-
127
-
128
-
129
-
130
-
131
-
132
-
133
-
134
-
 135
135 -
 136
136 -
 137
137 -
 138
138 -
 139
139 -
 140
140 -
 141
141 -
 142
142 -
 143
143 -
 144
144 -
 145
145 -
 146
146 -
 147
147 -
 148
148 -
 149
149 -
 150
150 -
 151
151 -
 152
152 -
 153
153 -
 154
154 -
 155
155 -
156
-
157
-
158
-
159
-
160
-
161
-
162
-
163
-
164
-
165
-
166
-
167
-
168
-
169
-
170
-
171
-
172
-
173
-
174
-
175
-
176
-
177
-
178
-
179
-
180
-
181
-
182
-
183
-
184
 |
 |
143
QANTAS ANNUAL REPORT 2013
Qantas Group
2013
$M
2012
$M
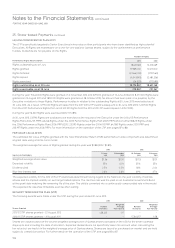
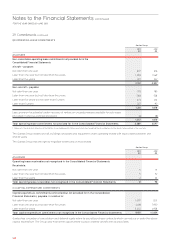
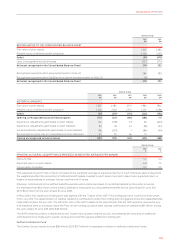
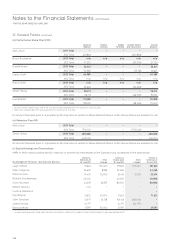
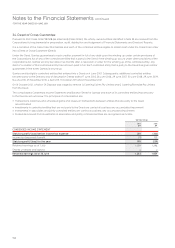
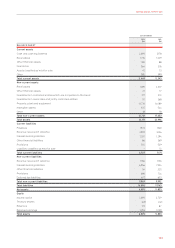
RECONCILIATION TO THE CONSOLIDATED BALANCE SHEET
Fair value of plan assets 2,367 2,082
Present value of dened benet obligation 2,426 2,561
Decit (59) (479)
Less: unrecognised actuarial losses (337) (772)
Net asset recognised in the Consolidated Balance Sheet 278 293
Recognised superannuation prepayment (refer to Note 14) 284 293
Recognised superannuation liabilities (included in provisions (refer to Note 22) (6) –
Net asset recognised in the Consolidated Balance Sheet 278 293
Qantas Group
2013
$M
2012
$M
2011
$M
2010
$M
2009
$M
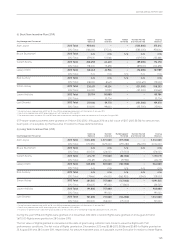
HISTORICAL AMOUNTS
Fair value of plan assets 2,367 2,082 2,101 1,964 1,944
Present value of dened benet obligation 2,426 2,561 2,274 2,210 2,098
Decit (59) (479) (173) (246) (154)
Opening unrecognised actuarial (losses)/gains (772) (431) (494) (380) 141
Experience adjustments gain/(loss) on plan assets 106 (178) (7) 36 (343)
Experience adjustments gain/(loss) on plan liabilities 83 18 43 (81) (37)
Actuarial estimate adjustments gain/(loss) on plan liabilities 196 (201) 1 (84) (141)
Recognised actuarial loss in Consolidated Income Statement 50 20 26 15 –
Closing unrecognised actuarial losses (337) (772) (431) (494) (380)
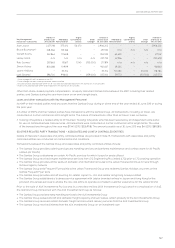
Qantas Group
2013
%
2012
%
PRINCIPAL ACTUARIAL ASSUMPTIONS EXPRESSED AS WEIGHTED AVERAGES PER ANNUM
Discount rate 5.2 4.4
Expected return on plan assets 6.8 7.2
Future salary increases 3.0 3.0
The expected long-term rate of return is based on the weighted average of expected returns on each individual asset class where
the weightings reect the proportion of dened benet assets invested in each asset class. Each asset class’ expected return is
based on expectations of average returns over the next 10 years.
Employer contributions to the dened benet superannuation plans are based on recommendations by the plans’ actuaries.
It is estimated that $104 million will be paid by Qantas for employees accruing dened benets for the year ended 30 June 2014
(2012:$104 million for the year ended 30 June 2013).
In May 2013 a new additional funding plan was agreed with the Trustee of the QSP. This funding plan is for a period of three years
from 1 July 2013. The determination of Qantas’ additional contributions under the funding plan is triggered where the Vested Benets
Index (VBI) is below 100 per cent. The VBI is the ratio of the QSP’s assets to the total amount that the QSP would be required to pay
if all members were to voluntarily leave the Plan on the funding valuation date. Qantas contributed an additional $35 million during
the year ended 30 June 2013 (2012: $33 million).
The QSP’s nancial position is monitored by the Trustee each quarter and the actuary recommends the amounts of additional
contributions to be made each quarter, as required under the agreed additional funding plan.
Dened Contribution Fund
The Qantas Group’s results include $165 million (2012: $157 million) of expenses in relation to dened contribution funds.