Qantas 2013 Annual Report Download - page 57
Download and view the complete annual report
Please find page 57 of the 2013 Qantas annual report below. You can navigate through the pages in the report by either clicking on the pages listed below, or by using the keyword search tool below to find specific information within the annual report.-
 1
1 -
2
-
3
-
4
-
5
-
6
-
7
-
8
-
9
-
10
-
11
-
12
-
13
-
14
-
15
-
16
-
17
-
18
-
19
-
20
-
21
-
22
-
23
-
24
-
25
-
26
-
27
-
28
-
29
-
30
-
31
-
32
-
33
-
34
-
35
-
36
-
37
-
38
-
39
-
40
-
41
-
42
-
43
-
44
-
45
-
46
-
 47
47 -
 48
48 -
 49
49 -
 50
50 -
 51
51 -
 52
52 -
 53
53 -
 54
54 -
 55
55 -
 56
56 -
 57
57 -
 58
58 -
 59
59 -
 60
60 -
 61
61 -
 62
62 -
 63
63 -
 64
64 -
 65
65 -
 66
66 -
 67
67 -
68
-
69
-
70
-
71
-
72
-
73
-
74
-
75
-
76
-
77
-
78
-
79
-
80
-
81
-
82
-
83
-
84
-
85
-
86
-
87
-
88
-
89
-
90
-
91
-
92
-
93
-
94
-
95
-
96
-
97
-
98
-
99
-
100
-
101
-
102
-
103
-
104
-
105
-
106
-
107
-
108
-
109
-
110
-
111
-
112
-
113
-
114
-
115
-
116
-
117
-
118
-
119
-
120
-
121
-
122
-
123
-
124
-
125
-
126
-
127
-
128
-
129
-
130
-
131
-
132
-
133
-
134
-
135
-
136
-
137
-
138
-
139
-
140
-
141
-
142
-
143
-
144
-
145
-
146
-
147
-
148
-
149
-
150
-
151
-
152
-
153
-
154
-
155
-
156
-
157
-
158
-
159
-
160
-
161
-
162
-
163
-
164
-
165
-
166
-
167
-
168
-
169
-
170
-
171
-
172
-
173
-
174
-
175
-
176
-
177
-
178
-
179
-
180
-
181
-
182
-
183
-
184
 |
 |

55
QANTAS ANNUAL REPORT 2013
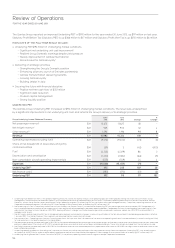
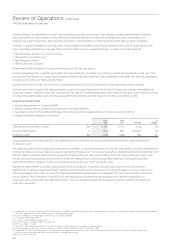
Operating statistics June
2013
June
2012 Change
%
Change
Available Seat Kilometres (ASK)9M 139,909 139,423 486 –
Revenue Passenger Kilometres (RPK)10 M 110,905 111,692 (787) (1)
Passengers Carried 000 48,276 46,708 1,568 3
Revenue Seat Factor11 % 79.3 80.1 (0.8) (1)
Yield (excluding FX)12 c/RPK 10.33 10.58 (0.25) (2)
Net Underlying Unit Cost2c/ASK 4.99 5.30 0.31 6
Comparable Unit Cost13 c/ASK 4.97 5.23 0.26 5
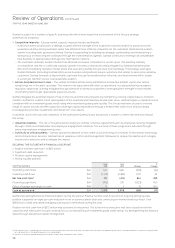
Revenue growth of one per cent was achieved despite a tough operating environment. A decline in yield was driven by excess domestic
market capacity, a mixed economic environment and aggressive competitive responses to the Qantas and Emirates partnership and
Jetstar’s Asian strategy. Competition has been particularly aggressive in the Asia-Pacic as the region’s relative economic strength
and the high Australian dollar have attracted foreign carriers looking to improve yield and leverage cost advantages. However this was
offset by growth in other revenue streams. Qantas Loyalty delivered continued growth in members and revenue to achieve another
record result3. Jetstar further improved its ancillary revenues per passenger, on top of nine per cent growth in passenger numbers.
Charter revenue almost doubled reecting Qantas’ market leading charter proposition.
Net passenger revenue includes a $134 million14 benet that follows a review of key accounting judgements and estimates for tickets
which have passed the ticketed travel date. This change aligns the timing of Group revenue recognition and the measurement
of revenue received in advance with ticket terms and conditions and historic experience.
Net freight revenue increased following the acquisition of Australian air Express in November 2012, offset by reductions in capacity
asaresult of the Qantas International network changes.
Other revenue includes a $125 million settlement following the restructuring of the Group’s Boeing 787 deliveries. This amount has
beenequally apportioned to Qantas International, Qantas Domestic and Jetstar Group. The additional revenue was partially offset
byareduction in third party contract revenue due to the sale of catering centres.
Qantas Group Net underlying unit cost2 improved six per cent. Comparable unit cost13 improved ve per cent despite the $56million
impact of the European hub transfer from Singapore to Dubai, a $31 million increase in losses resulting from the start-up of
Jetstar-branded airlines in Asia and $26 million back-pay following nalisation of the work place agreement for long-haul pilots.
Theunit cost improvement reects the benet of Qantas Transformation delivering results, successful growth in Jetstar and the control
of costs across the business. The introduction of the carbon tax drove up operating expenses by $106 million.
Fuel costs reduced two per cent on prior year. This was driven by eet modernisation and reconguration initiatives completed
duringthe year. The average fuel price remained high, in line with prior year.
The increase in net nance costs was driven by the full-year impact of the eet renewal program15.
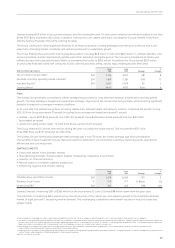
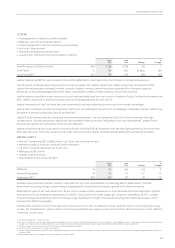
Segment Performance Summary June
2013
June
2012 Change
%
Change
Qantas Domestic $M 365 463 (98) (21)
Qantas International $M (246) (484) 238 49
Qantas Loyalty16 $M 260 231 29 13
Qantas Freight $M 36 45 (9) (20)
Qantas Brands Eliminations $M 3 (6) 9 >100
Qantas Brands $M 418 249 169 68
Jetstar Group $M 138 203 (65) (32)
Corporate/Unallocated $M (185) (191) 6 3
Eliminations $M 1 4 (3) (75)
Underlying EBIT $M 372 265 107 40
Net Finance Costs $M (180) (170) (10) (6)
Underlying PBT $M 192 95 97 102
9 ASK – total number of seats available for passengers, multiplied by the number of kilometres own.
10 RPK – total number of passengers carried, multiplied by the number of kilometres own.
11 Revenue Seat factor – RPKs divided by ASKs. Also known as seat factor, load factor or load.
12 Yield (excluding FX) – Passenger revenue excluding FX, divided by RPKs.
13 Comparable Unit Cost – Net Underlying Unit Cost adjusted for the impact of Industrial Action (2011/2012), Boeing settlement, change in estimate of passenger revenue received in
advance (2012/2013), carbon tax (2012/2013) and movements in average sector length.
14 The net passenger revenue benet of $134 million is represented by $80 million for Qantas Domestic and $54 million for Qantas International.
15 The eet renewal program was substantially completed in 2011/2012.
16 The Qantas Frequent Flyer segment was renamed Qantas Loyalty during the year.