Qantas 2013 Annual Report Download - page 61
Download and view the complete annual report
Please find page 61 of the 2013 Qantas annual report below. You can navigate through the pages in the report by either clicking on the pages listed below, or by using the keyword search tool below to find specific information within the annual report.-
 1
1 -
2
-
3
-
4
-
5
-
6
-
7
-
8
-
9
-
10
-
11
-
12
-
13
-
14
-
15
-
16
-
17
-
18
-
19
-
20
-
21
-
22
-
23
-
24
-
25
-
26
-
27
-
28
-
29
-
30
-
31
-
32
-
33
-
34
-
35
-
36
-
37
-
38
-
39
-
40
-
41
-
42
-
43
-
44
-
45
-
46
-
47
-
48
-
49
-
50
-
 51
51 -
 52
52 -
 53
53 -
 54
54 -
 55
55 -
 56
56 -
 57
57 -
 58
58 -
 59
59 -
 60
60 -
 61
61 -
 62
62 -
 63
63 -
 64
64 -
 65
65 -
 66
66 -
 67
67 -
 68
68 -
 69
69 -
 70
70 -
 71
71 -
72
-
73
-
74
-
75
-
76
-
77
-
78
-
79
-
80
-
81
-
82
-
83
-
84
-
85
-
86
-
87
-
88
-
89
-
90
-
91
-
92
-
93
-
94
-
95
-
96
-
97
-
98
-
99
-
100
-
101
-
102
-
103
-
104
-
105
-
106
-
107
-
108
-
109
-
110
-
111
-
112
-
113
-
114
-
115
-
116
-
117
-
118
-
119
-
120
-
121
-
122
-
123
-
124
-
125
-
126
-
127
-
128
-
129
-
130
-
131
-
132
-
133
-
134
-
135
-
136
-
137
-
138
-
139
-
140
-
141
-
142
-
143
-
144
-
145
-
146
-
147
-
148
-
149
-
150
-
151
-
152
-
153
-
154
-
155
-
156
-
157
-
158
-
159
-
160
-
161
-
162
-
163
-
164
-
165
-
166
-
167
-
168
-
169
-
170
-
171
-
172
-
173
-
174
-
175
-
176
-
177
-
178
-
179
-
180
-
181
-
182
-
183
-
184
 |
 |

59
QANTAS ANNUAL REPORT 2013
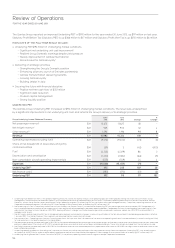
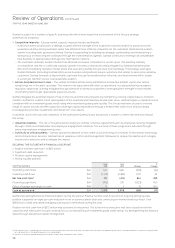
Qantas invested $1.3 billion in its customer product and eet during the year. Six new unencumbered aircraft were added to the eet
(three B737-800s and three A320-200s). In addition, several non-core assets were sold, including the Group’s interest in StarTrack
and the Sydney Riverside and Cairns catering facilities.
The Group continues to retain signicant exibility in its nancial position, funding strategies and eet plan to ensure that it can
respond to changing market conditions and remain positioned for sustainable growth.
The Group nished the period with a strong liquidity position including $2.8 billion in cash and $630 million in undrawn standby, and
revolving facilities. Qantas’ debt maturity prole was further extended during the period. The Group’s syndicated loan facility was
renanced and oversubscriptions were taken up increasing the facility to $550 million. In addition the Group issued $250 million
of unsecured xedrate notes with a maturity in 2020, with the proceeds being used to repay existing shorter-term debt.
Debt and Gearing Analysis June
2013
June
2012 Change
%
Change
Net on balance sheet debt26 $M 3,226 3,507 281 8
Net Debt including operating lease liabilities27 $M 4,819 5,367 548 10
Adjusted Equity28 $M 5,654 5,559 95 2
Gearing Ratio29 46:54 49:51 3pts 6
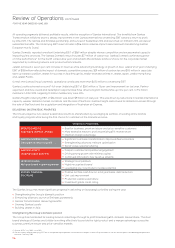
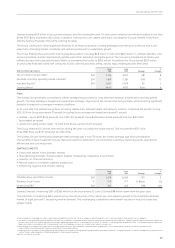
Fleet
The Qantas Group remains committed to a eet strategy that provides for long-term eet renewal, simplication and disciplined
growth. The eet strategy is designed to support the strategic objectives of the Group’s two ying brands, whilst retaining signicant
exibility to respond to changes in market conditions.
At 30 June 2013, the Qantas Group eet, including Jetstar Asia, Qantas Freight and Network Aviation, comprised 312 aircraft. During
2012/2013 the Group purchased 17 aircraft (including four purchased ex-lease) and leased 11 aircraft:
»Qantas – seven B737-800s (owned), one A330-200 (leased), three Bombardier Q400s (owned) and four B767-300s
(purchasedex-lease).
»Jetstar (including Jetstar Asia) – 13 A320-200s (three owned and 10 leased).
The Group removed 20 aircraft from service during the year including nine lease returns. This included ve B747-400s,
threeB767-300s, six B737-400s and six A320-200s.
The Qantas Group’s scheduled passenger eet average age is now 7.9 years, the lowest average age since privatisation.
Thebenets of eet investment include improved customer satisfaction, environmental outcomes, improving yields, operational
efciencies and cost reductions.
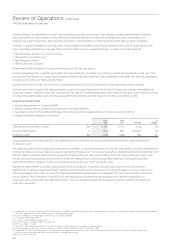
QANTAS DOMESTIC
»Clear prot leader in the domestic market
»Strengthening domestic market position despite challenging competitive environment
»Superior on-time performance
»Record levels of consistent customer satisfaction
» Enhancing regional and charter offering
June
2013
June
2012 Change
%
Change
Total Revenue and Other Income $M 6,218 6,063 155 3
Revenue Seat Factor %75.9 77.7 (1.8) pts (2)
Underlying EBIT $M 365 463 (98) (21)
Qantas Domestic Underlying EBIT of $365 million for the year ended 30 June 2013 was $98 million down from the prior year.
The reduction in Underlying EBIT was driven by the introduction of the carbon tax and capacity growth in the Australian domestic
market of eight per cent30, exceeding market demand. This challenging competitive environment resulted in reduced loads and
weaker yields.
26 Net on balance sheet debt includes interest-bearing liabilities and the fair value of hedges related to debt less cash, cash equivalents and aircraft security deposits.
27 Net debt including operating lease liabilities includes net on balance sheet debt and off balance sheet aircraft operating lease liabilities. Operating lease liabilities are measured as the
present value of minimum lease payments for aircraft operating leases which, in accordance with AASB 117: Leases, is not recognised on balance sheet. This operating lease liability has
been calculated in accordance with Standard and Poor’s methodology using an assumed interest rate of nine per cent.
28 Adjusted equity includes Equity adjusted to exclude hedge reserves, dened benet superannuation prepayments (net of deferred tax) and to include any vested benet
surplus/decit of dened benet superannuation plans (net of deferred tax).
29 Gearing Ratio is net debt including operating lease liability to net debt including operating lease liability and adjusted equity. The gearing ratio is used by management to represent the
Qantas Group’s debt obligation including obligations under operating leases.
30 BITRE July 2012 to June 2013.