Qantas 2013 Annual Report Download - page 176
Download and view the complete annual report
Please find page 176 of the 2013 Qantas annual report below. You can navigate through the pages in the report by either clicking on the pages listed below, or by using the keyword search tool below to find specific information within the annual report.-
 1
1 -
2
-
3
-
4
-
5
-
6
-
7
-
8
-
9
-
10
-
11
-
12
-
13
-
14
-
15
-
16
-
17
-
18
-
19
-
20
-
21
-
22
-
23
-
24
-
25
-
26
-
27
-
28
-
29
-
30
-
31
-
32
-
33
-
34
-
35
-
36
-
37
-
38
-
39
-
40
-
41
-
42
-
43
-
44
-
45
-
46
-
47
-
48
-
49
-
50
-
51
-
52
-
53
-
54
-
55
-
56
-
57
-
58
-
59
-
60
-
61
-
62
-
63
-
64
-
65
-
66
-
67
-
68
-
69
-
70
-
71
-
72
-
73
-
74
-
75
-
76
-
77
-
78
-
79
-
80
-
81
-
82
-
83
-
84
-
85
-
86
-
87
-
88
-
89
-
90
-
91
-
92
-
93
-
94
-
95
-
96
-
97
-
98
-
99
-
100
-
101
-
102
-
103
-
104
-
105
-
106
-
107
-
108
-
109
-
110
-
111
-
112
-
113
-
114
-
115
-
116
-
117
-
118
-
119
-
120
-
121
-
122
-
123
-
124
-
125
-
126
-
127
-
128
-
129
-
130
-
131
-
132
-
133
-
134
-
135
-
136
-
137
-
138
-
139
-
140
-
141
-
142
-
143
-
144
-
145
-
146
-
147
-
148
-
149
-
150
-
151
-
152
-
153
-
154
-
155
-
156
-
157
-
158
-
159
-
160
-
161
-
162
-
163
-
164
-
165
-
 166
166 -
 167
167 -
 168
168 -
 169
169 -
 170
170 -
 171
171 -
 172
172 -
 173
173 -
 174
174 -
 175
175 -
 176
176 -
 177
177 -
 178
178 -
 179
179 -
 180
180 -
 181
181 -
 182
182 -
 183
183 -
 184
184
 |
 |

174
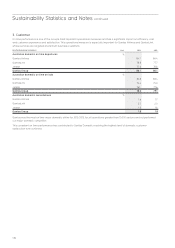
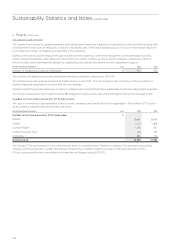
AUSTRALIAN ELECTRICITY USE, WATER USE AND DIRECT WASTE TO LANDFILL
The Qantas Group is committed to being an environmentally responsible organisation across all levels and functions of the
business. Targets for reduction of electricity, water and waste diverted directly to landll have brought together a wide range of
activities across all business areas, from corporate ofces to ground operations. Tracking this consumption facilitates the monitoring
of operational efciency and cost savings.
Key Performance Indicators Unit 2013 2012
Electricity (Australia) MWh 222,667 228,424
Water (Australia) ’000 Litres 901,917 975,412
Direct waste to landll (Australia) Tonnes 22,563 24,306
In 2011/2012 the Group refreshed its utility reduction strategy moving to new business unit specic targets. These targets are
aggregated at a Group level to give electricity, water and waste diverted directly to landll 2020 reduction targets of 10, 10 and
20per cent respectively (set against 2009/2010 baseline).
Due to signicant initiatives and business transformation, the Group is close to achieving its 2020 reduction targets, already
delivering a 5.3 per cent decrease in electricity consumption, a 9.8 per cent decrease in water consumption and a 19.7 per cent
decrease in waste diverted directly to landll against the 2009/2010 baseline. Given this early progress, the targets and scope are
being reviewed to continue to drive utility reductions.
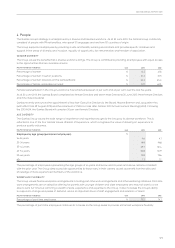
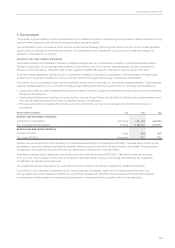
6. Community
As Australia’s national carrier, the Group has a responsibility to work with and contribute to the communities in which we operate
and live, and to improve community engagement. The 2013 Sustainability Review outlines the Group’s philanthropic activities.
Furthermore, the Group makes a contribution to the community through national export revenue (bringing overseas visitors into
Australia) and to domestic and regional tourism (carrying passengers within Australia).
Key Performance Indicators Unit 2013 2012
Tourism spending by Qantas Group passengers $M
National export revenue 5,227 5,372
Domestic traveller expenditure 22,732 22,255
In 2012/2013, the Group made a direct contribution to national export revenue of $5.2 billion, 2.7 per cent lower than 2011/2012. The
reduction was driven by a decrease in the number of international visitors brought to Australia by the Qantas Group. This does not
take into account passengers travelling with the Group’s codeshare or alliance partners.
The Group’s contribution to domestic traveller expenditure was 2.1 per cent higher than 2011/2012. This improvement was driven
by an increase in the number of domestic passengers carried by Qantas Group carriers.
Sustainability Statistics and Notes continued
continue
d