Qantas 2013 Annual Report Download - page 123
Download and view the complete annual report
Please find page 123 of the 2013 Qantas annual report below. You can navigate through the pages in the report by either clicking on the pages listed below, or by using the keyword search tool below to find specific information within the annual report.-
 1
1 -
2
-
3
-
4
-
5
-
6
-
7
-
8
-
9
-
10
-
11
-
12
-
13
-
14
-
15
-
16
-
17
-
18
-
19
-
20
-
21
-
22
-
23
-
24
-
25
-
26
-
27
-
28
-
29
-
30
-
31
-
32
-
33
-
34
-
35
-
36
-
37
-
38
-
39
-
40
-
41
-
42
-
43
-
44
-
45
-
46
-
47
-
48
-
49
-
50
-
51
-
52
-
53
-
54
-
55
-
56
-
57
-
58
-
59
-
60
-
61
-
62
-
63
-
64
-
65
-
66
-
67
-
68
-
69
-
70
-
71
-
72
-
73
-
74
-
75
-
76
-
77
-
78
-
79
-
80
-
81
-
82
-
83
-
84
-
85
-
86
-
87
-
88
-
89
-
90
-
91
-
92
-
93
-
94
-
95
-
96
-
97
-
98
-
99
-
100
-
101
-
102
-
103
-
104
-
105
-
106
-
107
-
108
-
109
-
110
-
111
-
112
-
 113
113 -
 114
114 -
 115
115 -
 116
116 -
 117
117 -
 118
118 -
 119
119 -
 120
120 -
 121
121 -
 122
122 -
 123
123 -
 124
124 -
 125
125 -
 126
126 -
 127
127 -
 128
128 -
 129
129 -
 130
130 -
 131
131 -
 132
132 -
 133
133 -
134
-
135
-
136
-
137
-
138
-
139
-
140
-
141
-
142
-
143
-
144
-
145
-
146
-
147
-
148
-
149
-
150
-
151
-
152
-
153
-
154
-
155
-
156
-
157
-
158
-
159
-
160
-
161
-
162
-
163
-
164
-
165
-
166
-
167
-
168
-
169
-
170
-
171
-
172
-
173
-
174
-
175
-
176
-
177
-
178
-
179
-
180
-
181
-
182
-
183
-
184
 |
 |
121
QANTAS ANNUAL REPORT 2013
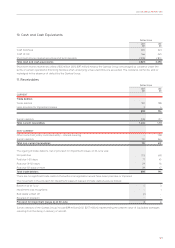
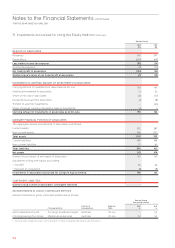
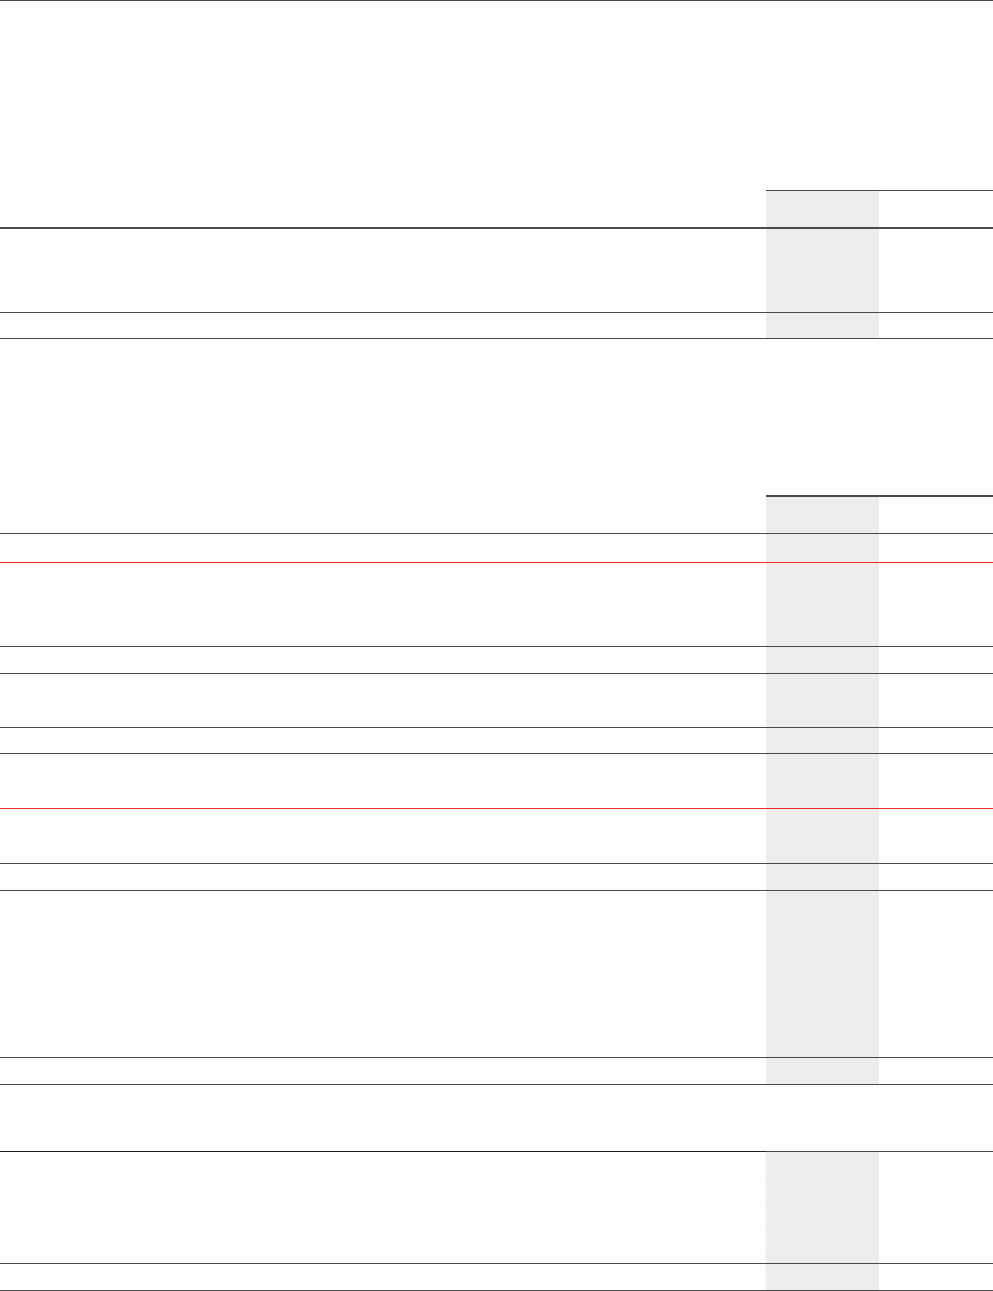
10. Cash and Cash Equivalents
Qantas Group
2013
$M
2012
$M
Cash balances 265 343
Cash at call 166 245
Short-term money market securities and term deposits 2,398 2,810
Total cash and cash equivalents 2,829 3,398
Short-term money market securities of $14 million (2012: $97 million) held by the Qantas Group are pledged as collateral under the
terms of certain operational nancing facilities when underlying unsecured limits are exceeded. The collateral cannot be sold or
repledged in the absence of default by the Qantas Group.
11. Receivables
Qantas Group
2013
$M
2012
$M
CURRENT
Trade debtors
Trade debtors 901 798
Less: provision for impairment losses 34
898 794
Sundry debtors 538 317
Total current receivables 1,436 1,111
NONCURRENT
Other loans from jointly controlled entity – interest-bearing –128
Sundry debtors 174 344
Total non-current receivables 174 472
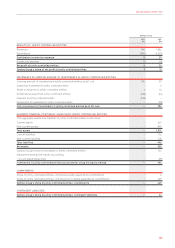
The ageing of trade debtors, net of provision for impairment losses, at 30 June was:
Not past due 753 691
Past due 1–30 days 77 40
Past due 31–120 days 29 16
Past due 121 days or more 39 47
Total trade debtors 898 794
There are no signicant trade debtors that without renegotiation would have been past due or impaired.
The movement in the provision for impairment losses in respect of trade debtors was as follows:
Balance as at 1 July 43
Impairment loss recognised –1
Bad debts written off (1) –
Reversal of provision ––
Provision for impairment losses as at 30 June 34
Sundry debtors of the Qantas Group include $99 million (2012: $257 million), representing the present value of liquidated damages
resulting from the delay in delivery of aircraft.