Qantas 2013 Annual Report Download - page 89
Download and view the complete annual report
Please find page 89 of the 2013 Qantas annual report below. You can navigate through the pages in the report by either clicking on the pages listed below, or by using the keyword search tool below to find specific information within the annual report.-
 1
1 -
2
-
3
-
4
-
5
-
6
-
7
-
8
-
9
-
10
-
11
-
12
-
13
-
14
-
15
-
16
-
17
-
18
-
19
-
20
-
21
-
22
-
23
-
24
-
25
-
26
-
27
-
28
-
29
-
30
-
31
-
32
-
33
-
34
-
35
-
36
-
37
-
38
-
39
-
40
-
41
-
42
-
43
-
44
-
45
-
46
-
47
-
48
-
49
-
50
-
51
-
52
-
53
-
54
-
55
-
56
-
57
-
58
-
59
-
60
-
61
-
62
-
63
-
64
-
65
-
66
-
67
-
68
-
69
-
70
-
71
-
72
-
73
-
74
-
75
-
76
-
77
-
78
-
 79
79 -
 80
80 -
 81
81 -
 82
82 -
 83
83 -
 84
84 -
 85
85 -
 86
86 -
 87
87 -
 88
88 -
 89
89 -
 90
90 -
 91
91 -
 92
92 -
 93
93 -
 94
94 -
 95
95 -
 96
96 -
 97
97 -
 98
98 -
 99
99 -
100
-
101
-
102
-
103
-
104
-
105
-
106
-
107
-
108
-
109
-
110
-
111
-
112
-
113
-
114
-
115
-
116
-
117
-
118
-
119
-
120
-
121
-
122
-
123
-
124
-
125
-
126
-
127
-
128
-
129
-
130
-
131
-
132
-
133
-
134
-
135
-
136
-
137
-
138
-
139
-
140
-
141
-
142
-
143
-
144
-
145
-
146
-
147
-
148
-
149
-
150
-
151
-
152
-
153
-
154
-
155
-
156
-
157
-
158
-
159
-
160
-
161
-
162
-
163
-
164
-
165
-
166
-
167
-
168
-
169
-
170
-
171
-
172
-
173
-
174
-
175
-
176
-
177
-
178
-
179
-
180
-
181
-
182
-
183
-
184
 |
 |

87
QANTAS ANNUAL REPORT 2013
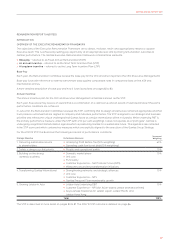
Annual Incentive
also referred to
as the Short Term
Incentive Plan
or STIP
(continued)
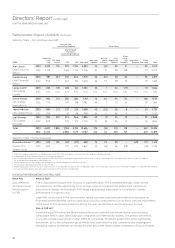
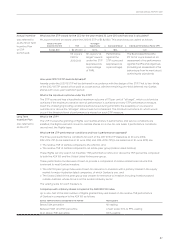
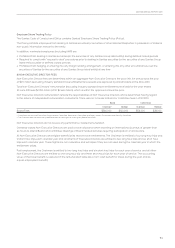
What was the STIP award for the CEO for the year ended 30 June 2013 and how was it calculated?
Mr Joyce received an award under the 2012/13 STIP of $1,162,800. This award was calculated as follows:
Value of the STIP
Award to the CEO = FAR x
“At Target”
Opportunity x Scorecard Result x Individual Performance Factor (IPF)
$1,162,800 = $2,125,000 x 120% x 38% x 1.20
Mr Joyce’s
FAR for
2012/2013.
Mr Joyce’s “at
target” reward
under the STIP
(expressed as
apercentage
of FAR).
Performance
against the
STIP scorecard
(expressed as
a percentage).
The Board determined the
IPF for Mr Joyce based on an
assessment of his performance
against his KPIs and objectives
(including an assessment of his
behaviours/how he went about
achieving his objectives).
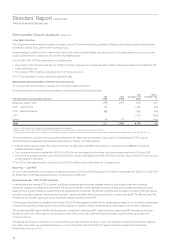
How were 2012/13 STIP awards delivered?
Awards under the 2012/13 STIP will be delivered in accordance with the design of the STIP. That is, two-thirds
of the 2012/13 STIP award will be paid as a cash bonus, with the remaining one-third deferred into Qantas
shares with a two year restriction period.
What is the maximum outcome under the STIP?
The STIP scorecard has a hypothetical maximum outcome of 175 per cent of “at target”, which could only be
achieved if the maximum overdrive level of performance is achieved on every STIP performance measure.
Given the challenging trading conditions Qantas faced during 2012/2013, the possibility of a scorecard
outcome at or above the “at target” amount was not considered. The minimum outcome is nil, which would
occur if the threshold level of performance is missed on each STIP measure.
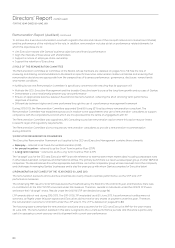
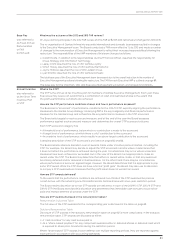
Long Term
Incentive Plan
also referred to
asthe LTIP
What is the LTIP?
The LTIP involves the granting of Rights over Qantas shares. If performance and service conditions are
satised, the Rights vest and convert to Qantas shares on a one-for-one basis. If performance conditions
are not met, the Rights lapse.
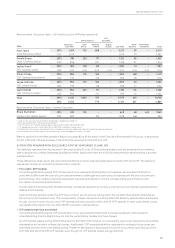
What are the LTIP performance conditions and how is performance assessed?
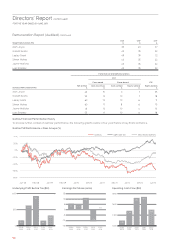
The three year performance conditions for each of the 2011–2013 LTIP (tested as at 30 June 2013),
2012–2014LTIP (to be tested as at 30 June 2014) and 2013–2015 LTIP (to be tested as at 30 June 2015) are:
»The relative TSR of Qantas compared to the ASX 100, and
»The relative TSR of Qantas compared to an airline peer group (Global Listed Airlines)
These Rights will only vest in full if Qantas’ TSR performance ranks at or above the 75th percentile compared
to both the ASX 100 and the Global Listed Airline peer group.
These performance hurdles were chosen to provide a comparison of relative shareholder returns that
is relevant to most Qantas investors:
»The ASX 100 peer group Index was chosen for relevance to investors with a primary interest in the equity
market for major Australian listed companies, of which Qantas is one, and
»The Global Listed Airline peer group was chosen for relevance to investors including investors based
outside Australia, whose focus is on the aviation industry sector
The vesting scale for each measure is:
Companies with ordinary shares included in the S&P/ASX 100 Index
Up to one-half of the total number of Rights granted may vest based on the relative TSR performance
of Qantas in comparison to the ASX 100 as follows:
Qantas TSR Performance Compared to the ASX 100 Vesting Scale
Below 50th percentile Nil vesting
Between 50th and 75th percentile Linear scale: 50% to 99% vesting
At or above 75th percentile 100% vesting