Qantas 2013 Annual Report Download - page 10
Download and view the complete annual report
Please find page 10 of the 2013 Qantas annual report below. You can navigate through the pages in the report by either clicking on the pages listed below, or by using the keyword search tool below to find specific information within the annual report.-
 1
1 -
 2
2 -
 3
3 -
 4
4 -
 5
5 -
 6
6 -
 7
7 -
 8
8 -
 9
9 -
 10
10 -
 11
11 -
 12
12 -
 13
13 -
 14
14 -
 15
15 -
 16
16 -
 17
17 -
 18
18 -
 19
19 -
 20
20 -
 21
21 -
22
-
23
-
24
-
25
-
26
-
27
-
28
-
29
-
30
-
31
-
32
-
33
-
34
-
35
-
36
-
37
-
38
-
39
-
40
-
41
-
42
-
43
-
44
-
45
-
46
-
47
-
48
-
49
-
50
-
51
-
52
-
53
-
54
-
55
-
56
-
57
-
58
-
59
-
60
-
61
-
62
-
63
-
64
-
65
-
66
-
67
-
68
-
69
-
70
-
71
-
72
-
73
-
74
-
75
-
76
-
77
-
78
-
79
-
80
-
81
-
82
-
83
-
84
-
85
-
86
-
87
-
88
-
89
-
90
-
91
-
92
-
93
-
94
-
95
-
96
-
97
-
98
-
99
-
100
-
101
-
102
-
103
-
104
-
105
-
106
-
107
-
108
-
109
-
110
-
111
-
112
-
113
-
114
-
115
-
116
-
117
-
118
-
119
-
120
-
121
-
122
-
123
-
124
-
125
-
126
-
127
-
128
-
129
-
130
-
131
-
132
-
133
-
134
-
135
-
136
-
137
-
138
-
139
-
140
-
141
-
142
-
143
-
144
-
145
-
146
-
147
-
148
-
149
-
150
-
151
-
152
-
153
-
154
-
155
-
156
-
157
-
158
-
159
-
160
-
161
-
162
-
163
-
164
-
165
-
166
-
167
-
168
-
169
-
170
-
171
-
172
-
173
-
174
-
175
-
176
-
177
-
178
-
179
-
180
-
181
-
182
-
183
-
184
 |
 |

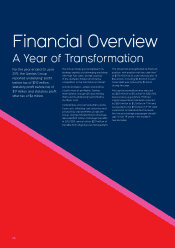
Financial Overview
A Year of Transformation
For the year ended 30 June
2013, the Qantas Group
reported underlying* prot
before tax of $192 million,
statutory prot before tax of
$17 million and statutory prot
after tax of $6 million.
The Group made good progress in its
strategy against a challenging backdrop,
with high fuel costs, excess capacity
in the domestic market and intense
competition in the international market.
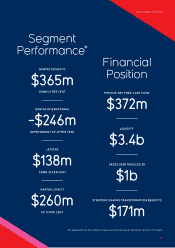
Qantas Domestic, Jetstar and Qantas
Loyalty were all protable. Qantas
International, though still loss-making,
improved its underlying* performance
by49 per cent.
Comparable unit cost* was improved by
5 per cent, reecting cost reduction and
productivity improvements across the
Group. Qantas Transformation initiatives
delivered $171 million of strategic benets
in 2012/2013, and a further $257million of
benets from ongoing cost management.
The Group has strengthened its nancial
position, with positive net free cash ow*
of $372 million at 30 June and liquidity* of
$3.4 billion, including $2.8 billion in cash.
Gross debt was reduced by $1 billion
during the year.
Net capital expenditure was reduced
by$200 million to $1.4 billion in 2012/2013,
below previous guidance. Planned
capital expenditure has been reduced
by$300 million to $1.2 billion in FY14 and
is expected to be $1.5 billion in FY15. After
a period of accelerated eet renewal,
the Group’s average passenger aircraft
age is now 7.9 years — the lowest in
twodecades.
08