Qantas 2013 Annual Report Download - page 139
Download and view the complete annual report
Please find page 139 of the 2013 Qantas annual report below. You can navigate through the pages in the report by either clicking on the pages listed below, or by using the keyword search tool below to find specific information within the annual report.-
 1
1 -
2
-
3
-
4
-
5
-
6
-
7
-
8
-
9
-
10
-
11
-
12
-
13
-
14
-
15
-
16
-
17
-
18
-
19
-
20
-
21
-
22
-
23
-
24
-
25
-
26
-
27
-
28
-
29
-
30
-
31
-
32
-
33
-
34
-
35
-
36
-
37
-
38
-
39
-
40
-
41
-
42
-
43
-
44
-
45
-
46
-
47
-
48
-
49
-
50
-
51
-
52
-
53
-
54
-
55
-
56
-
57
-
58
-
59
-
60
-
61
-
62
-
63
-
64
-
65
-
66
-
67
-
68
-
69
-
70
-
71
-
72
-
73
-
74
-
75
-
76
-
77
-
78
-
79
-
80
-
81
-
82
-
83
-
84
-
85
-
86
-
87
-
88
-
89
-
90
-
91
-
92
-
93
-
94
-
95
-
96
-
97
-
98
-
99
-
100
-
101
-
102
-
103
-
104
-
105
-
106
-
107
-
108
-
109
-
110
-
111
-
112
-
113
-
114
-
115
-
116
-
117
-
118
-
119
-
120
-
121
-
122
-
123
-
124
-
125
-
126
-
127
-
128
-
 129
129 -
 130
130 -
 131
131 -
 132
132 -
 133
133 -
 134
134 -
 135
135 -
 136
136 -
 137
137 -
 138
138 -
 139
139 -
 140
140 -
 141
141 -
 142
142 -
 143
143 -
 144
144 -
 145
145 -
 146
146 -
 147
147 -
 148
148 -
 149
149 -
150
-
151
-
152
-
153
-
154
-
155
-
156
-
157
-
158
-
159
-
160
-
161
-
162
-
163
-
164
-
165
-
166
-
167
-
168
-
169
-
170
-
171
-
172
-
173
-
174
-
175
-
176
-
177
-
178
-
179
-
180
-
181
-
182
-
183
-
184
 |
 |

137
QANTAS ANNUAL REPORT 2013
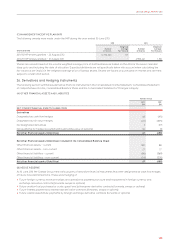
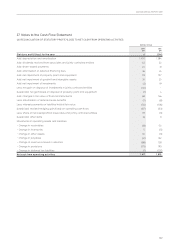
27. Notes to the Cash Flow Statement
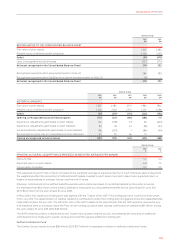
A RECONCILIATION OF STATUTORY PROFIT/LOSS TO NET CASH FROM OPERATING ACTIVITIES
Qantas Group
2013
$M
2012
$M
Statutory prot/(loss) for the year 6(244)
Add: depreciation and amortisation 1,450 1,384
Add: dividends received from associates and jointly controlled entities 142 22
Add: share-based payments 20 31
Add: amortisation of deferred nancing fees 26 24
Add: net impairment of property, plant and equipment 93 157
Add: net impairment of goodwill and intangible assets 24 20
Add: net impairment of investments (2) 19
Less: net gain on disposal of investments in jointly controlled entities (30) –
(Less)/add: net gain/(loss) on disposal of property, plant and equipment (1) 4
Add: changes in fair value of nancial instruments 68 146
Less: amortisation of deferred lease benets (7) (8)
Less: interest payments on liabilities held at fair value (56) (106)
(Less)/add: realised hedging gain/(loss) on operating cash ows (87) (33)
Less: share of net loss/(prot) of associates and jointly controlled entities 39 (3)
(Less)/add: other items 18 9
Movements in operating assets and liabilities:
– Change in receivables (18) 50
– Change in inventories 5 (5)
– Change in other assets 30 (3)
– Change in payables (41) 132
– Change in revenue received in advance (88) 128
– Change in provisions (173) 193
– Change in deferred tax liabilities (1) (107)
Net cash from operating activities 1,417 1,810