Qantas 2013 Annual Report Download - page 100
Download and view the complete annual report
Please find page 100 of the 2013 Qantas annual report below. You can navigate through the pages in the report by either clicking on the pages listed below, or by using the keyword search tool below to find specific information within the annual report.-
 1
1 -
2
-
3
-
4
-
5
-
6
-
7
-
8
-
9
-
10
-
11
-
12
-
13
-
14
-
15
-
16
-
17
-
18
-
19
-
20
-
21
-
22
-
23
-
24
-
25
-
26
-
27
-
28
-
29
-
30
-
31
-
32
-
33
-
34
-
35
-
36
-
37
-
38
-
39
-
40
-
41
-
42
-
43
-
44
-
45
-
46
-
47
-
48
-
49
-
50
-
51
-
52
-
53
-
54
-
55
-
56
-
57
-
58
-
59
-
60
-
61
-
62
-
63
-
64
-
65
-
66
-
67
-
68
-
69
-
70
-
71
-
72
-
73
-
74
-
75
-
76
-
77
-
78
-
79
-
80
-
81
-
82
-
83
-
84
-
85
-
86
-
87
-
88
-
89
-
 90
90 -
 91
91 -
 92
92 -
 93
93 -
 94
94 -
 95
95 -
 96
96 -
 97
97 -
 98
98 -
 99
99 -
 100
100 -
 101
101 -
 102
102 -
 103
103 -
 104
104 -
 105
105 -
 106
106 -
 107
107 -
 108
108 -
 109
109 -
 110
110 -
111
-
112
-
113
-
114
-
115
-
116
-
117
-
118
-
119
-
120
-
121
-
122
-
123
-
124
-
125
-
126
-
127
-
128
-
129
-
130
-
131
-
132
-
133
-
134
-
135
-
136
-
137
-
138
-
139
-
140
-
141
-
142
-
143
-
144
-
145
-
146
-
147
-
148
-
149
-
150
-
151
-
152
-
153
-
154
-
155
-
156
-
157
-
158
-
159
-
160
-
161
-
162
-
163
-
164
-
165
-
166
-
167
-
168
-
169
-
170
-
171
-
172
-
173
-
174
-
175
-
176
-
177
-
178
-
179
-
180
-
181
-
182
-
183
-
184
 |
 |

98
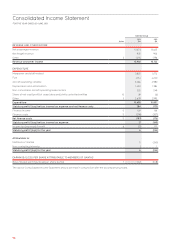
Consolidated Income Statement
FOR THE YEAR ENDED 30 JUNE 2013
Qantas Group
Notes
2013
$M
2012
$M
REVENUE AND OTHER INCOME
Net passenger revenue 13,673 13,625
Net freight revenue 935 903
Other 3 1,294 1,196
Revenue and other income 15,902 15,724
EXPENDITURE
Manpower and staff related 3,825 3,774
Fuel 4,154 4,220
Aircraft operating variable 3,066 2,980
Depreciation and amortisation 1,450 1,384
Non-cancellable aircraft operating lease rentals 525 549
Share of net loss/(prot) of associates and jointly controlled entities 15 39 (3)
Other 32,6392,993
Expenditure 15,698 15,897
Statutory prot/(loss) before income tax expense and net nance costs 204 (173)
Finance income 5109 181
Finance costs 5 (296) (357)
Net nance costs 5(187) (176)
Statutory prot/(loss) before income tax expense 17 (349)
Income tax (expense)/benet 6(11)105
Statutory prot/(loss) for the year 6(244)
Attributable to:
Members of Qantas 5 (245)
Non-controlling interests 11
Statutory prot/(loss) for the year 6(244)
EARNINGS/LOSS PER SHARE ATTRIBUTABLE TO MEMBERS OF QANTAS
Basic/diluted earnings/(loss) per share (cents) 7 0.2 (10.8)
The above Consolidated Income Statement should be read in conjunction with the accompanying notes.