Qantas 2013 Annual Report Download - page 128
Download and view the complete annual report
Please find page 128 of the 2013 Qantas annual report below. You can navigate through the pages in the report by either clicking on the pages listed below, or by using the keyword search tool below to find specific information within the annual report.-
 1
1 -
2
-
3
-
4
-
5
-
6
-
7
-
8
-
9
-
10
-
11
-
12
-
13
-
14
-
15
-
16
-
17
-
18
-
19
-
20
-
21
-
22
-
23
-
24
-
25
-
26
-
27
-
28
-
29
-
30
-
31
-
32
-
33
-
34
-
35
-
36
-
37
-
38
-
39
-
40
-
41
-
42
-
43
-
44
-
45
-
46
-
47
-
48
-
49
-
50
-
51
-
52
-
53
-
54
-
55
-
56
-
57
-
58
-
59
-
60
-
61
-
62
-
63
-
64
-
65
-
66
-
67
-
68
-
69
-
70
-
71
-
72
-
73
-
74
-
75
-
76
-
77
-
78
-
79
-
80
-
81
-
82
-
83
-
84
-
85
-
86
-
87
-
88
-
89
-
90
-
91
-
92
-
93
-
94
-
95
-
96
-
97
-
98
-
99
-
100
-
101
-
102
-
103
-
104
-
105
-
106
-
107
-
108
-
109
-
110
-
111
-
112
-
113
-
114
-
115
-
116
-
117
-
 118
118 -
 119
119 -
 120
120 -
 121
121 -
 122
122 -
 123
123 -
 124
124 -
 125
125 -
 126
126 -
 127
127 -
 128
128 -
 129
129 -
 130
130 -
 131
131 -
 132
132 -
 133
133 -
 134
134 -
 135
135 -
 136
136 -
 137
137 -
 138
138 -
139
-
140
-
141
-
142
-
143
-
144
-
145
-
146
-
147
-
148
-
149
-
150
-
151
-
152
-
153
-
154
-
155
-
156
-
157
-
158
-
159
-
160
-
161
-
162
-
163
-
164
-
165
-
166
-
167
-
168
-
169
-
170
-
171
-
172
-
173
-
174
-
175
-
176
-
177
-
178
-
179
-
180
-
181
-
182
-
183
-
184
 |
 |

126
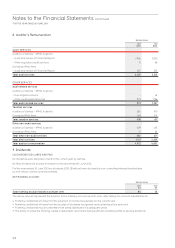
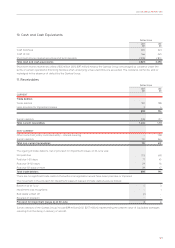
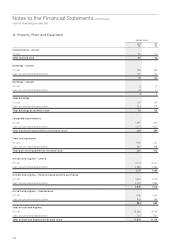
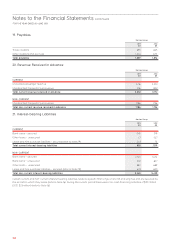
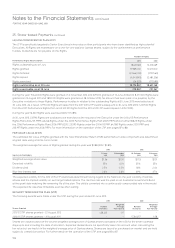
16. Property, Plant and Equipment
Qantas Group
2013
$M
2012
$M
Freehold land – owned
At cost 50 50
Total freehold land 50 50
Buildings – owned
At cost 266 266
Less: accumulated depreciation 155 144
111 122
Buildings – leased
At cost 51 51
Less: accumulated depreciation 48 47
34
Total buildings
At cost 317 317
Less: accumulated depreciation 203 191
Total buildings at net book value 114 126
Leasehold improvements
At cost 1,695 1,619
Less: accumulated depreciation 1,075 1,030
Total leasehold improvements at net book value 620 589
Plant and equipment
At cost 1,496 1,421
Less: accumulated depreciation 960 898
Total plant and equipment at net book value 536 523
Aircraft and engines – owned
At cost 11,703 12,047
Less: accumulated depreciation 4,386 4,764
7,317 7,283
Aircraft and engines – nance leased and hire purchased
At cost 4,967 5,079
Less: accumulated depreciation 2,092 1,969
2,875 3,110
Aircraft and engines – maintenance
At cost 1,816 1,673
Less: accumulated depreciation 933 788
883 885
Total aircraft and engines
At cost 18,486 18,799
Less: accumulated depreciation 7,411 7,521
Total aircraft and engines at net book value 11,075 11,278
Notes to the Financial Statements continued
FOR THE YEAR ENDED 30 JUNE 2013