Qantas 2013 Annual Report Download - page 179
Download and view the complete annual report
Please find page 179 of the 2013 Qantas annual report below. You can navigate through the pages in the report by either clicking on the pages listed below, or by using the keyword search tool below to find specific information within the annual report.-
 1
1 -
2
-
3
-
4
-
5
-
6
-
7
-
8
-
9
-
10
-
11
-
12
-
13
-
14
-
15
-
16
-
17
-
18
-
19
-
20
-
21
-
22
-
23
-
24
-
25
-
26
-
27
-
28
-
29
-
30
-
31
-
32
-
33
-
34
-
35
-
36
-
37
-
38
-
39
-
40
-
41
-
42
-
43
-
44
-
45
-
46
-
47
-
48
-
49
-
50
-
51
-
52
-
53
-
54
-
55
-
56
-
57
-
58
-
59
-
60
-
61
-
62
-
63
-
64
-
65
-
66
-
67
-
68
-
69
-
70
-
71
-
72
-
73
-
74
-
75
-
76
-
77
-
78
-
79
-
80
-
81
-
82
-
83
-
84
-
85
-
86
-
87
-
88
-
89
-
90
-
91
-
92
-
93
-
94
-
95
-
96
-
97
-
98
-
99
-
100
-
101
-
102
-
103
-
104
-
105
-
106
-
107
-
108
-
109
-
110
-
111
-
112
-
113
-
114
-
115
-
116
-
117
-
118
-
119
-
120
-
121
-
122
-
123
-
124
-
125
-
126
-
127
-
128
-
129
-
130
-
131
-
132
-
133
-
134
-
135
-
136
-
137
-
138
-
139
-
140
-
141
-
142
-
143
-
144
-
145
-
146
-
147
-
148
-
149
-
150
-
151
-
152
-
153
-
154
-
155
-
156
-
157
-
158
-
159
-
160
-
161
-
162
-
163
-
164
-
165
-
166
-
167
-
168
-
 169
169 -
 170
170 -
 171
171 -
 172
172 -
 173
173 -
 174
174 -
 175
175 -
 176
176 -
 177
177 -
 178
178 -
 179
179 -
 180
180 -
 181
181 -
 182
182 -
 183
183 -
 184
184
 |
 |

177
QANTAS ANNUAL REPORT 2013
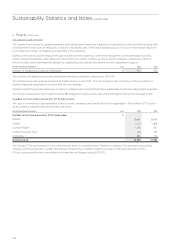
Australian Domestic Aviation Fuel Carbon Emissions
The amount of greenhouse gas emissions within Australia
measured in CO2-e tonnes generated from aviation fuel
consumption (as dened above) from 1 July to 30 June that
is attributable to domestic coded ights.
Scope:
Emissions from aviation fuel consumption by domestic ights
of Qantas, Jetstar, QantasLink and Network Aviation. Domestic
aviation fuel consumption by Australian air Express is included
from 1 December 2012, the rst full month after this entity was
acquired by the Group.
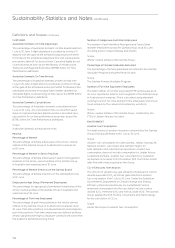
Fuel per 100 Revenue Tonne Kilometres (RTKs)
Aviation fuel consumption per 100 RTKs from 1 July to 30 June.
Revenue tonne kilometres (RTKs) is the total number of tonnes
of paying passengers, freight and mail carried, multiplied by
the number of kilometres own.
Scope:
Wholly-owned entities of the Qantas Group, excluding
NetworkAviation.
CO2-e per 100 RTKs
Fuel per 100 RTKs (as dened above) converted to CO2-e tonnes
by the NGA Factors.
Scope:
Wholly-owned entities of the Qantas Group, excluding
NetworkAviation.
Electricity (Australia)
The total amount of electricity consumed as measured in
megawatt hours (MWh) where electricity is separately billed
for the period 1 July to 30 June.
Scope:
Qantas Group sites within Australia.
Water (Australia)
The total amount of water consumed as measured in kilolitres
where water is separately billed for the period 1 July to 30 June.
Scope:
Qantas Group sites within Australia.
Direct Waste to Landll (Australia)
The total solid waste and quarantine waste generated, as
measured in tonnes, where this waste is delivered from Qantas
premises directly to a landll site and where the Qantas Group is
responsible for the waste removal and is separately billed (that
is, where there is a separately identied item on a bill for waste
and is not part of a general overhead charge) for the period
1July to 30 June.
Scope:
Qantas Group sites within Australia.
COMMUNITY
National Export Revenue
National export revenue is calculated as the number of inbound
visitors brought to Australia by Qantas, Jetstar and Jetstar Asia
for the 12 months to 31 May (latest available data as at 30 June)
multiplied by the estimated average visitor expenditure of $3,331.
(Source: Tourism Australia’s March 2013 International Visitor
Survey (latest available data)) (2012: $3,313 (Source: Tourism
Australia’s March 2012 International Visitor Survey)). This amount
does not include the value of airfare and freight charges that
accrue to the Qantas Group from overseas sources. These also
represent export revenue.
Domestic Traveller Expenditure
Domestic traveller expenditure is calculated as the number
of Qantas Group domestic passengers for the nancial year
multiplied by the estimated average expenditure per visitor
of $674 (Source: Tourism Australia’s March 2013 National Visitor
Survey (latest available data)) (2012: $681 (Source: Tourism
Australia’s March 2012 National Visitor Survey)). This amount
includes the value of related airfares. As it is not possible to
disaggregate the data, the calculation should be viewed as
indicative only, eg the gure may include some international
visitor expenditure (where domestic ights are purchased after
arrival in Australia) or understate the expenditure associated
with domestic ights which are ‘round trip’.