Qantas 2013 Annual Report Download - page 170
Download and view the complete annual report
Please find page 170 of the 2013 Qantas annual report below. You can navigate through the pages in the report by either clicking on the pages listed below, or by using the keyword search tool below to find specific information within the annual report.-
 1
1 -
2
-
3
-
4
-
5
-
6
-
7
-
8
-
9
-
10
-
11
-
12
-
13
-
14
-
15
-
16
-
17
-
18
-
19
-
20
-
21
-
22
-
23
-
24
-
25
-
26
-
27
-
28
-
29
-
30
-
31
-
32
-
33
-
34
-
35
-
36
-
37
-
38
-
39
-
40
-
41
-
42
-
43
-
44
-
45
-
46
-
47
-
48
-
49
-
50
-
51
-
52
-
53
-
54
-
55
-
56
-
57
-
58
-
59
-
60
-
61
-
62
-
63
-
64
-
65
-
66
-
67
-
68
-
69
-
70
-
71
-
72
-
73
-
74
-
75
-
76
-
77
-
78
-
79
-
80
-
81
-
82
-
83
-
84
-
85
-
86
-
87
-
88
-
89
-
90
-
91
-
92
-
93
-
94
-
95
-
96
-
97
-
98
-
99
-
100
-
101
-
102
-
103
-
104
-
105
-
106
-
107
-
108
-
109
-
110
-
111
-
112
-
113
-
114
-
115
-
116
-
117
-
118
-
119
-
120
-
121
-
122
-
123
-
124
-
125
-
126
-
127
-
128
-
129
-
130
-
131
-
132
-
133
-
134
-
135
-
136
-
137
-
138
-
139
-
140
-
141
-
142
-
143
-
144
-
145
-
146
-
147
-
148
-
149
-
150
-
151
-
152
-
153
-
154
-
155
-
156
-
157
-
158
-
159
-
 160
160 -
 161
161 -
 162
162 -
 163
163 -
 164
164 -
 165
165 -
 166
166 -
 167
167 -
 168
168 -
 169
169 -
 170
170 -
 171
171 -
 172
172 -
 173
173 -
 174
174 -
 175
175 -
 176
176 -
 177
177 -
 178
178 -
 179
179 -
 180
180 -
181
-
182
-
183
-
184
 |
 |

168
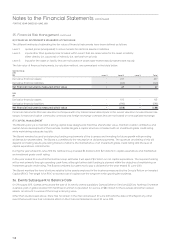
Sustainability Statistics and Notes continued
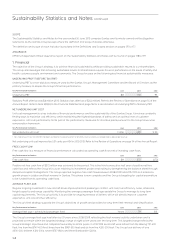
SCOPE
The Sustainability Statistics and Notes for the year ended 30 June 2013 comprise Qantas and its wholly-owned entities (together
referred to as the Qantas Group) except where the denition and scope indicates otherwise.
The denition and scope of each indicator is provided in the Denitions and Scopes section on pages 175 to 177.
ASSURANCE
KPMG’s independent limited assurance report on the Sustainability Statistics and Notes can be found on pages 178 to 179.
1. Financial
The objective of the Group’s strategy is to achieve nancial sustainability whilst providing sustainable returns to our
shareholders.
The Group acknowledges that achieving sustainable returns to shareholders requires focus on performance in the areas of safety and
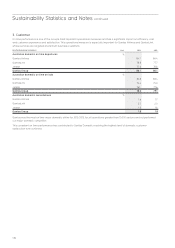
health, customer, people, environment and community
. The Group focuses on the following key nancial sustainability measures:
UNDERLYING PROFIT BEFORE TAX PBT
Underlying PBT is a non-statutory measure used by the Qantas Group’s Management Committee and the Board of Directors as the
primary measure to assess the Group’s nancial performance.
Key Performance Indicators Unit 2013 2012
Underlying PBT $M 192 95
Statutory Prot after tax was $6 million (2012: Statutory loss after tax of $244 million). Refer to the Review of Operations on page 54 of the
Annual Report. Refer to Note 2(D)(iii) to the Financial Statements on page 116 for a reconciliation of Underlying PBT to Statutory PBT.
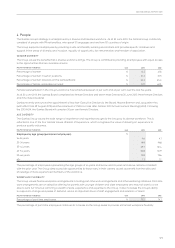
NET UNDERLYING UNIT COST
Unit cost management is a key indicator of nancial performance and the sustainability of the Qantas Group. It involves constantly
nding ways to maximise cost efciency while maintaining the highest standards of safety and an optimal level of customer
experience. Unit cost performance forms part of the performance measures for incentive plans pursuant to the Group’s Executive
remuneration framework.
Key Performance Indicators Unit 2013 2012
Net underlying unit cost1
C/ASK
4.99 5.30
1 Net underlying unit cost for 2011/2012 has been restated to include an element of ancillary revenue, previously categorised as passenger revenue.
Net underlying unit cost improved by 0.31 cents per ASK in 2012/2013. Refer to the Review of Operations on page 54 of the Annual Report.
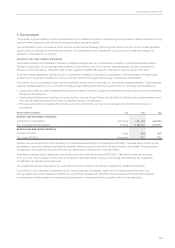
FREE CASH FLOW
Free cash ow is a measure of nancial performance calculated as operating cash ows net of investing cash ows.
Key Performance Indicators Unit 2013 2012
Free cash ow $M 372 (472)
Positive net free cash ow of $372 million was achieved for the period. This is the third consecutive half year of positive net free
cash ow and reects the Group’s focus on retaining its investment grade credit rating by strengthening the balance sheet through
disciplined capital management. The Group reported negative free cash ows between 2008/2009 and 2011/2012 as it entered a
growth phase in Jetstar and eet renewal in Qantas. This phase is now complete and the Group is targeting for capital expenditure
to be funded from its operating cash ows.
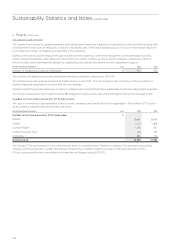
AVERAGE FLEET AGE
Regular ongoing investment in new aircraft drives improvements in passenger comfort, unit cost, fuel efciency, noise, emissions,
freight capacity and range capability. Monitoring the average passenger eet age assists the Group to manage its long-term
capital requirements. The Group’s priority is to provide for ongoing renewal of its eet, which will directly improve customer
experience, unit cost and fuel efciency.
The Group’s eet strategy supports the Group’s objectives of growth and provides for long-term eet renewal and simplication.
Key Performance Indicators Unit 2013 2012
Average eet age – scheduled passenger eet Years 7.9 8.3
The Group’s average eet age has fallen by 0.9 years since 2008/2009, reecting the eet renewal activity undertaken and is
projected to remain within the targeted strategic range of eight to ten years over the long term. This targeted range reects the
Group’s strategic objectives and compares favourably to airline peers. In 2012/2013 six aircraft were retired from the Boeing 737-400
eet, ve from the B747-400 eet, three from the B767-300 eet and six from the A320-200 eet. The Group took delivery of one
A330-200, thirteen A320-200s, seven B737-800s and three Bombardier Q400s.