Qantas 2013 Annual Report Download - page 127
Download and view the complete annual report
Please find page 127 of the 2013 Qantas annual report below. You can navigate through the pages in the report by either clicking on the pages listed below, or by using the keyword search tool below to find specific information within the annual report.-
 1
1 -
2
-
3
-
4
-
5
-
6
-
7
-
8
-
9
-
10
-
11
-
12
-
13
-
14
-
15
-
16
-
17
-
18
-
19
-
20
-
21
-
22
-
23
-
24
-
25
-
26
-
27
-
28
-
29
-
30
-
31
-
32
-
33
-
34
-
35
-
36
-
37
-
38
-
39
-
40
-
41
-
42
-
43
-
44
-
45
-
46
-
47
-
48
-
49
-
50
-
51
-
52
-
53
-
54
-
55
-
56
-
57
-
58
-
59
-
60
-
61
-
62
-
63
-
64
-
65
-
66
-
67
-
68
-
69
-
70
-
71
-
72
-
73
-
74
-
75
-
76
-
77
-
78
-
79
-
80
-
81
-
82
-
83
-
84
-
85
-
86
-
87
-
88
-
89
-
90
-
91
-
92
-
93
-
94
-
95
-
96
-
97
-
98
-
99
-
100
-
101
-
102
-
103
-
104
-
105
-
106
-
107
-
108
-
109
-
110
-
111
-
112
-
113
-
114
-
115
-
116
-
 117
117 -
 118
118 -
 119
119 -
 120
120 -
 121
121 -
 122
122 -
 123
123 -
 124
124 -
 125
125 -
 126
126 -
 127
127 -
 128
128 -
 129
129 -
 130
130 -
 131
131 -
 132
132 -
 133
133 -
 134
134 -
 135
135 -
 136
136 -
 137
137 -
138
-
139
-
140
-
141
-
142
-
143
-
144
-
145
-
146
-
147
-
148
-
149
-
150
-
151
-
152
-
153
-
154
-
155
-
156
-
157
-
158
-
159
-
160
-
161
-
162
-
163
-
164
-
165
-
166
-
167
-
168
-
169
-
170
-
171
-
172
-
173
-
174
-
175
-
176
-
177
-
178
-
179
-
180
-
181
-
182
-
183
-
184
 |
 |
125
QANTAS ANNUAL REPORT 2013
Qantas Group
2013
$M
2012
$M
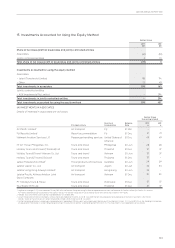
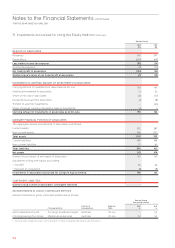
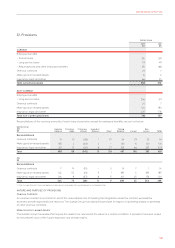
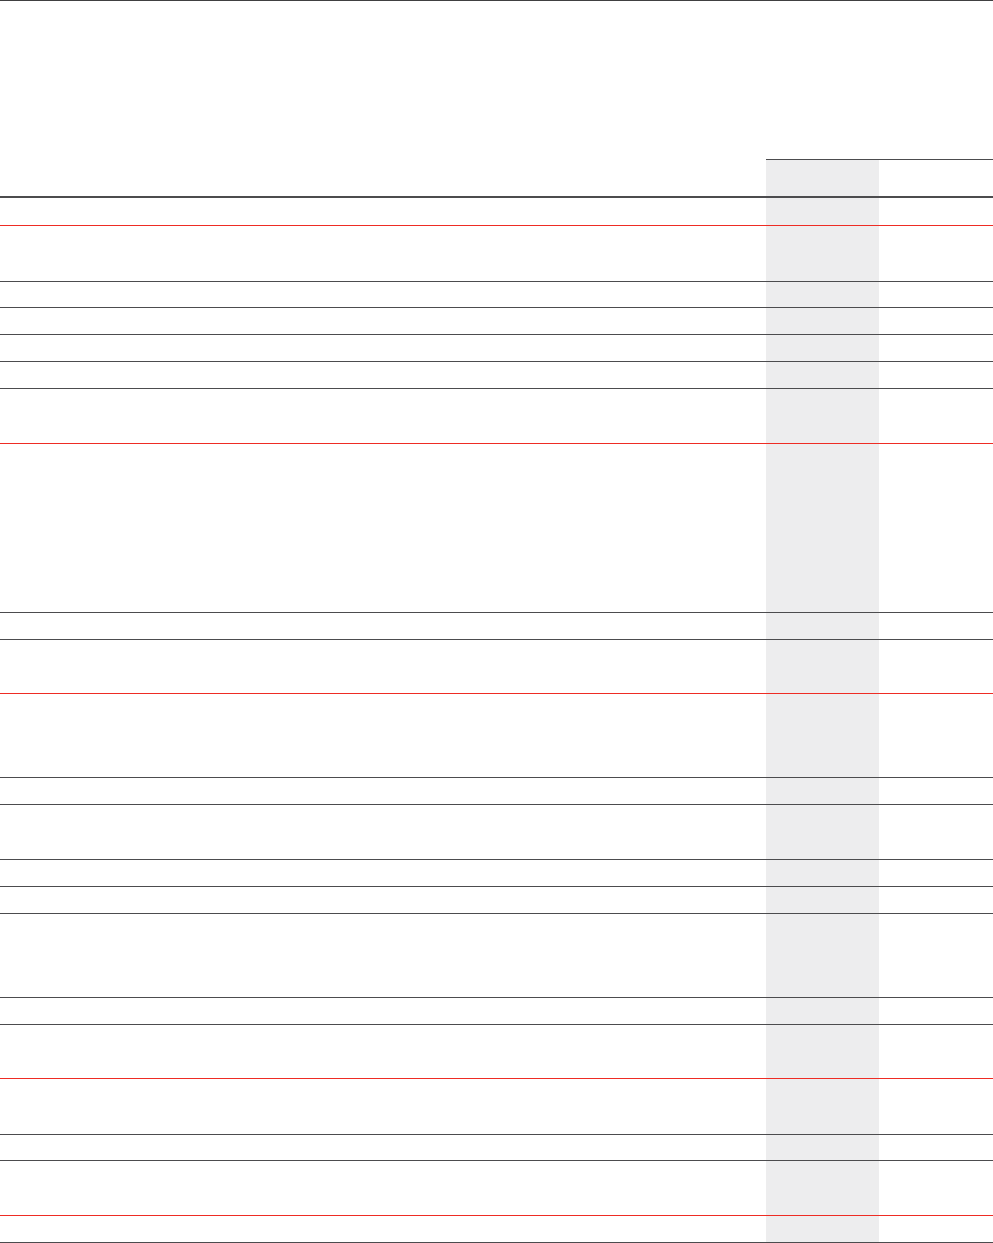
RESULTS OF JOINTLY CONTROLLED ENTITIES
Revenues 595 1,354
Expenditure (590) (1,325)
Prot before income tax expense 529
Income tax expense (1) (3)
Net prot of jointly controlled entities 426
Qantas Group’s share of net prot of jointly controlled entities 2 13
MOVEMENTS IN CARRYING AMOUNT OF INVESTMENTS IN JOINTLY CONTROLLED ENTITIES
Carrying amount of investments in jointly controlled entities as at 1 July 294 311
Additional investment in jointly controlled entity –3
Share of net prot of jointly controlled entities 213
Dividends received from jointly controlled entities (138) (14)
Disposal of jointly controlled entity (158) –
Impairment of investment in jointly controlled entity – (19)
Carrying amount of investments in jointly controlled entities as at 30 June – 294
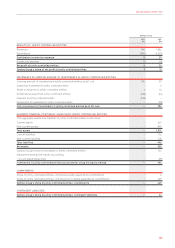
SUMMARY FINANCIAL POSITION OF SIGNIFICANT JOINTLY CONTROLLED ENTITIES
The aggregate assets and liabilities of jointly controlled entities is as follows:
Current assets –205
Non-current assets –867
Total assets –1,072
Current liabilities –170
Non-current liabilities –276
Total liabilities –446
Net assets –626
Qantas Group’s share of net assets of jointly controlled entities –313
Adjustment arising from equity accounting
– Accumulated impairment –(19)
Investments in jointly controlled entities accounted for using the equity method – 294
COMMITMENTS
Share of jointly controlled entities’ contracted capital expenditure commitments –6
Share of jointly controlled entities’ contracted non-capital expenditure commitments – 439
Qantas Group’s share of jointly controlled entities’ commitments – 445
CONTINGENT LIABILITIES
Qantas Group’s share of jointly controlled entities’ contingent liabilities – 24