Qantas 2012 Annual Report Download - page 95
Download and view the complete annual report
Please find page 95 of the 2012 Qantas annual report below. You can navigate through the pages in the report by either clicking on the pages listed below, or by using the keyword search tool below to find specific information within the annual report.-
 1
1 -
2
-
3
-
4
-
5
-
6
-
7
-
8
-
9
-
10
-
11
-
12
-
13
-
14
-
15
-
16
-
17
-
18
-
19
-
20
-
21
-
22
-
23
-
24
-
25
-
26
-
27
-
28
-
29
-
30
-
31
-
32
-
33
-
34
-
35
-
36
-
37
-
38
-
39
-
40
-
41
-
42
-
43
-
44
-
45
-
46
-
47
-
48
-
49
-
50
-
51
-
52
-
53
-
54
-
55
-
56
-
57
-
58
-
59
-
60
-
61
-
62
-
63
-
64
-
65
-
66
-
67
-
68
-
69
-
70
-
71
-
72
-
73
-
74
-
75
-
76
-
77
-
78
-
79
-
80
-
81
-
82
-
83
-
84
-
 85
85 -
 86
86 -
 87
87 -
 88
88 -
 89
89 -
 90
90 -
 91
91 -
 92
92 -
 93
93 -
 94
94 -
 95
95 -
 96
96 -
 97
97 -
 98
98 -
 99
99 -
 100
100 -
 101
101 -
 102
102 -
 103
103 -
 104
104 -
 105
105 -
106
-
107
-
108
-
109
-
110
-
111
-
112
-
113
-
114
-
115
-
116
-
117
-
118
-
119
-
120
-
121
-
122
-
123
-
124
-
125
-
126
-
127
-
128
-
129
-
130
-
131
-
132
-
133
-
134
-
135
-
136
-
137
-
138
-
139
-
140
-
141
-
142
-
143
-
144
-
145
-
146
-
147
-
148
-
149
-
150
-
151
-
152
-
153
-
154
-
155
-
156
 |
 |

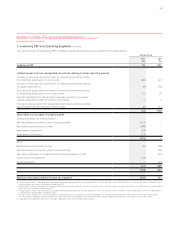
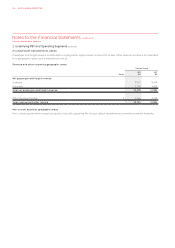
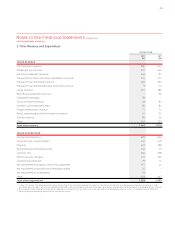
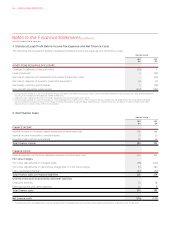
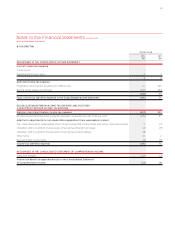
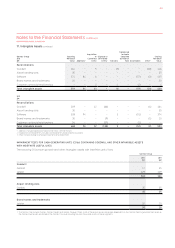
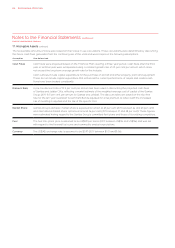
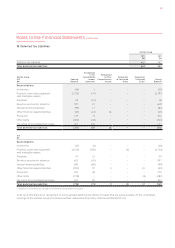
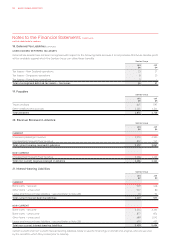
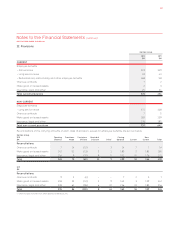
FOR THE YEAR ENDED 30 JUNE 2012
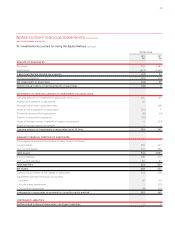
Notes to the Financial Statements continued
Qantas Group
2012
$M
2011
$M
RESULTS OF ASSOCIATES
Revenues ,
Expenditure () (,)
(Loss)/profit before income tax expense ()
Income tax expense () ()
Net (loss)/profit of associates ()
Qantas Group’s share of net (loss)/profit of associates ()
MOVEMENTS IN CARRYING AMOUNT OF INVESTMENTS IN ASSOCIATES
Carrying amount of investments in associates as at July
Additional investment in associates –
Reclassification from controlled entity –
Share of net (loss)/profit of associates ()
Dividends received from associates () ()
Transfer to external investments () –
Share of foreign currency translation reserve movements ()
Share of hedge reserve movement –
Carrying amount of investments in associates as at June
SUMMARY FINANCIAL POSITION OF ASSOCIATES
The aggregate assets and liabilities of associates is as follows:
Current assets
Non-current assets
Total assets ,
Current liabilities
Non-current liabilities
Total liabilities
Net assets
Qantas Group’s share of net assets of associates
Adjustment arising from equity accounting
– Goodwill
– Accumulated impairment – ()
– Discount on acquisition () ()
Investments in associates accounted for using the equity method
CONTINGENT LIABILITIES
Qantas Group’s share of associates’ contingent liabilities –
15. Investments Accounted for Using the Equity Method continued
093