Qantas 2012 Annual Report Download - page 60
Download and view the complete annual report
Please find page 60 of the 2012 Qantas annual report below. You can navigate through the pages in the report by either clicking on the pages listed below, or by using the keyword search tool below to find specific information within the annual report.-
 1
1 -
2
-
3
-
4
-
5
-
6
-
7
-
8
-
9
-
10
-
11
-
12
-
13
-
14
-
15
-
16
-
17
-
18
-
19
-
20
-
21
-
22
-
23
-
24
-
25
-
26
-
27
-
28
-
29
-
30
-
31
-
32
-
33
-
34
-
35
-
36
-
37
-
38
-
39
-
40
-
41
-
42
-
43
-
44
-
45
-
46
-
47
-
48
-
49
-
 50
50 -
 51
51 -
 52
52 -
 53
53 -
 54
54 -
 55
55 -
 56
56 -
 57
57 -
 58
58 -
 59
59 -
 60
60 -
 61
61 -
 62
62 -
 63
63 -
 64
64 -
 65
65 -
 66
66 -
 67
67 -
 68
68 -
 69
69 -
 70
70 -
71
-
72
-
73
-
74
-
75
-
76
-
77
-
78
-
79
-
80
-
81
-
82
-
83
-
84
-
85
-
86
-
87
-
88
-
89
-
90
-
91
-
92
-
93
-
94
-
95
-
96
-
97
-
98
-
99
-
100
-
101
-
102
-
103
-
104
-
105
-
106
-
107
-
108
-
109
-
110
-
111
-
112
-
113
-
114
-
115
-
116
-
117
-
118
-
119
-
120
-
121
-
122
-
123
-
124
-
125
-
126
-
127
-
128
-
129
-
130
-
131
-
132
-
133
-
134
-
135
-
136
-
137
-
138
-
139
-
140
-
141
-
142
-
143
-
144
-
145
-
146
-
147
-
148
-
149
-
150
-
151
-
152
-
153
-
154
-
155
-
156
 |
 |
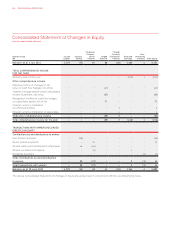
FOR THE YEAR ENDED 30 JUNE 2012
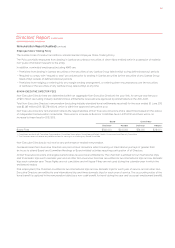
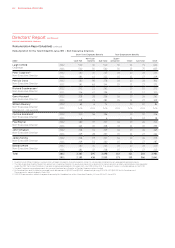
Directors’ Report continued
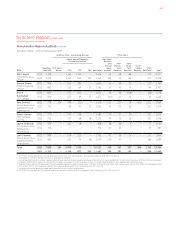
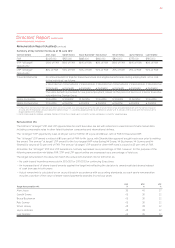
Performance Related Remuneration
Cash-Based STIP LTIP
Statutory Remuneration Mix
FAR & Other
%
Cash Incentives
%
Cash-settled
%
Equity-settled
%
Rights Awards
%
Alan Joyce –
Gareth Evans –
Bruce Buchanan –
Rob Gurney –
Simon Hickey –
Jayne Hrdlicka –
Lyell Strambi –
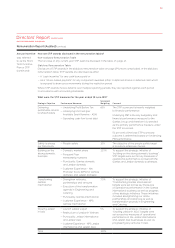
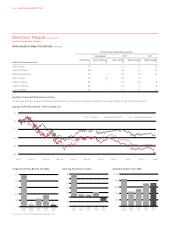
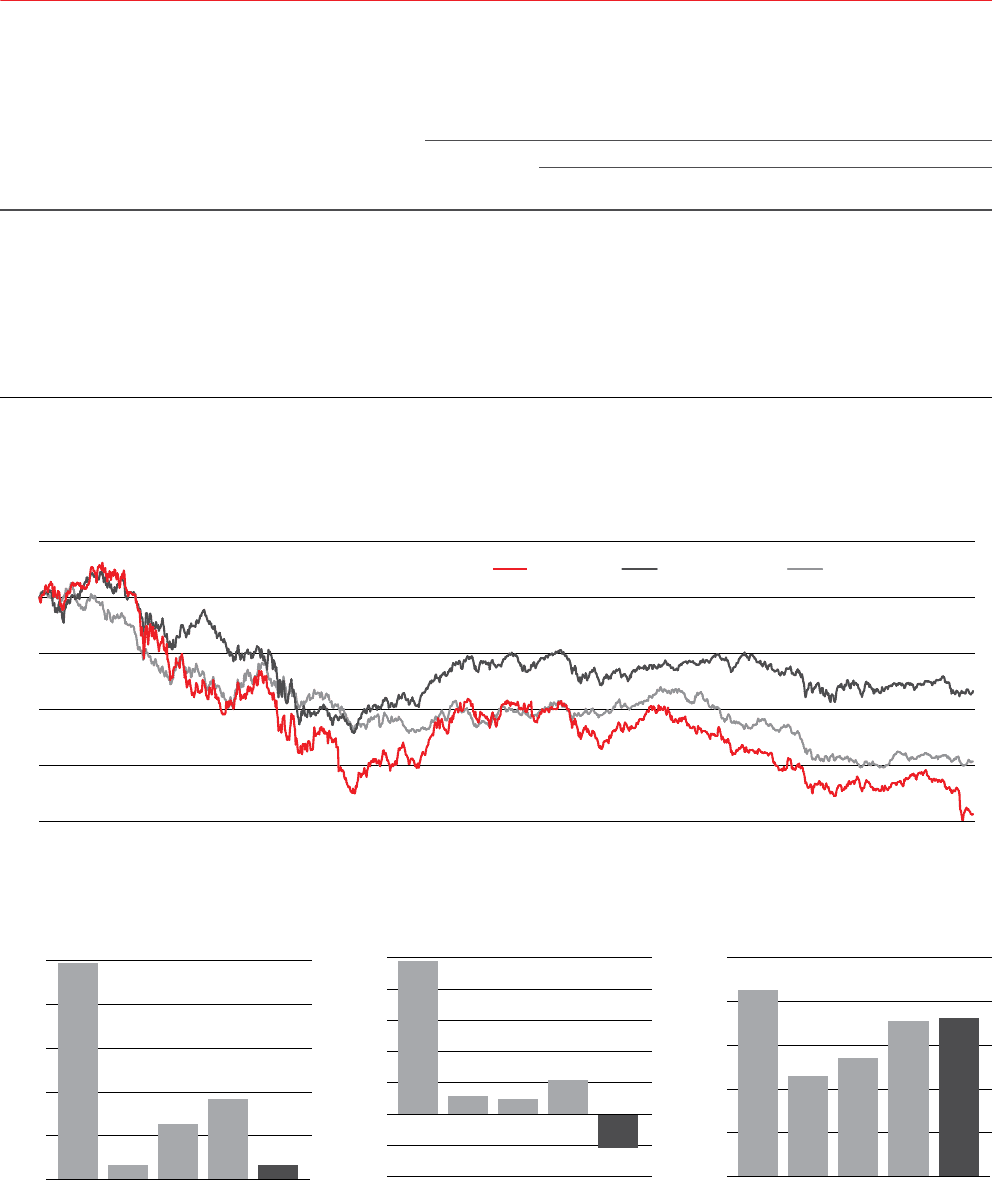
Qantas Financial Performance History
To provide further context on Qantas’ performance, the following graphs outline a five-year history of key financial metrics.
-0.8
-0.6
-0.4
-0.2
0.0
0.2
Jul 07
Qantas TSR Performance v Peer Groups (%)
Dec 07 Jun 08 Dec 08 Jun 09 Dec 09 Jun 10 Dec 10 Jun 11 Dec 11 Jun 12
Qantas S&P/ASX 100 MSCI World Airlines
Underlying Profit Before Tax ($M)
0
300
600
900
1,200
1,500
2007/
2008*
2008/
2009 2009/
2010 2010/
2011 2011/
2012
1,408
100
377
552
95
* Figures for 2007/2008 are based on Statutory PBT.
Earning Per Share (cents)
-20
-10
0
10
20
30
40
50
2007/
2008 2008/
2009 2009/
2010 2010/
2011 2011/
2012
49.0
5.6 4.9
11.0
-10.8
Operating Cash Flow ($M)
0
500
1,000
1,500
2,000
2,500
2007/
2008 2008/
2009 2009/
2010 2010/
2011 2011/
2012
2,128
1,149
1,351
1,782 1,810
Remuneration Report (Audited) continued
QANTAS ANNUAL REPORT 2012058