Qantas 2012 Annual Report Download - page 131
Download and view the complete annual report
Please find page 131 of the 2012 Qantas annual report below. You can navigate through the pages in the report by either clicking on the pages listed below, or by using the keyword search tool below to find specific information within the annual report.-
 1
1 -
2
-
3
-
4
-
5
-
6
-
7
-
8
-
9
-
10
-
11
-
12
-
13
-
14
-
15
-
16
-
17
-
18
-
19
-
20
-
21
-
22
-
23
-
24
-
25
-
26
-
27
-
28
-
29
-
30
-
31
-
32
-
33
-
34
-
35
-
36
-
37
-
38
-
39
-
40
-
41
-
42
-
43
-
44
-
45
-
46
-
47
-
48
-
49
-
50
-
51
-
52
-
53
-
54
-
55
-
56
-
57
-
58
-
59
-
60
-
61
-
62
-
63
-
64
-
65
-
66
-
67
-
68
-
69
-
70
-
71
-
72
-
73
-
74
-
75
-
76
-
77
-
78
-
79
-
80
-
81
-
82
-
83
-
84
-
85
-
86
-
87
-
88
-
89
-
90
-
91
-
92
-
93
-
94
-
95
-
96
-
97
-
98
-
99
-
100
-
101
-
102
-
103
-
104
-
105
-
106
-
107
-
108
-
109
-
110
-
111
-
112
-
113
-
114
-
115
-
116
-
117
-
118
-
119
-
120
-
 121
121 -
 122
122 -
 123
123 -
 124
124 -
 125
125 -
 126
126 -
 127
127 -
 128
128 -
 129
129 -
 130
130 -
 131
131 -
 132
132 -
 133
133 -
 134
134 -
 135
135 -
 136
136 -
 137
137 -
 138
138 -
 139
139 -
 140
140 -
 141
141 -
142
-
143
-
144
-
145
-
146
-
147
-
148
-
149
-
150
-
151
-
152
-
153
-
154
-
155
-
156
 |
 |

FOR THE YEAR ENDED 30 JUNE 2012
Notes to the Financial Statements continued
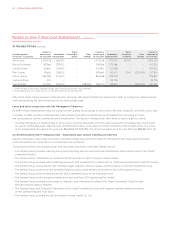
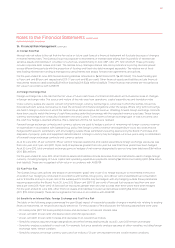
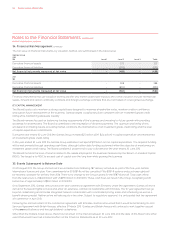
The Qantas Group minimises the concentration of credit risk by undertaking transactions with a large number of customers and
counterparties in various countries in accordance with Board approved policy. As at 30 June 2012 the credit risk of the Qantas Group
to counterparties in relation to other financial assets, cash and cash equivalents, and other financial liabilities where a right of offset
exists, amounted to $3,423 million (2011: $3,607 million) and was spread over a number of regions, including Australia, Asia, Europe
and the United States. Excluding associated entities, the Qantas Group’s credit exposure is with counterparties that have a minimum
credit rating of A-/A3, unless individually approved by the Board.
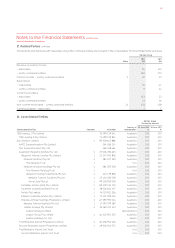
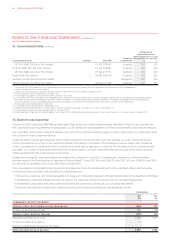
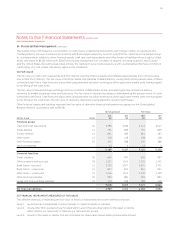
D FAIR VALUE
The fair value of cash, cash equivalents and non-interest-bearing financial assets and liabilities approximates their carrying value
due to their short maturity. The fair value of financial assets and liabilities is determined by valuing them at the present value of future
contracted cash flows. Cash flows are discounted using standard valuation techniques at the applicable market yield, having regard
to the timing of the cash flows.
The fair value of forward foreign exchange and fuel contracts is determined as the unrealised gain/loss at balance date by
reference to market exchange rates and fuel prices. The fair value of interest rate swaps is determined as the present value of future
contracted cash flows. Cash flows are discounted using standard valuation techniques at the applicable market yield, having regard
to the timing of the cash flows. The fair value of options is determined using standard valuation techniques.
Other financial assets and liabilities represent the fair value of derivative financial instruments recognised on the Consolidated
Balance Sheet in accordance with AASB 139.
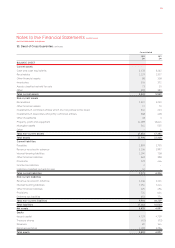
Carrying Amount Fair Value
Qantas Group Notes
2012
$M
2011
$M
2012
$M
2011
$M
Financial assets
Cash and cash equivalents , , , ,
Trade debtors
Sundry debtors
Other loans
Other financial assets
Other investments
, , , ,
Financial liabilities
Trade creditors
Other creditors and accruals , , , ,
Bank loans – secured , , , ,
Bank loans – unsecured
Other loans – unsecured , , , ,
Other financial liabilities
Lease and hire purchase liabilities
, , , ,
Net financial liabilities , , , ,
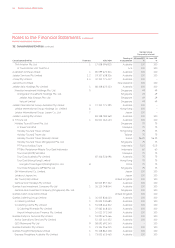
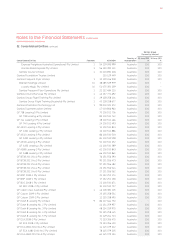
E FINANCIAL INSTRUMENTS MEASURED AT FAIR VALUE
The different methods of estimating the fair value of financial instruments have been defined as follows:
Level 1: quoted prices (unadjusted) in active markets for identical assets or liabilities
Level 2: inputs other than quoted prices included within Level 1 that are observable for the asset or liability,
either directly (i.e. as prices) or indirectly (i.e. derived from prices)
Level 3: inputs for the asset or liability that are not based on observable market data (unobservable inputs)
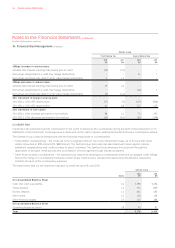
34. Financial Risk Management continued
129