Qantas 2012 Annual Report Download - page 21
Download and view the complete annual report
Please find page 21 of the 2012 Qantas annual report below. You can navigate through the pages in the report by either clicking on the pages listed below, or by using the keyword search tool below to find specific information within the annual report.-
 1
1 -
2
-
3
-
4
-
5
-
6
-
7
-
8
-
9
-
10
-
 11
11 -
 12
12 -
 13
13 -
 14
14 -
 15
15 -
 16
16 -
 17
17 -
 18
18 -
 19
19 -
 20
20 -
 21
21 -
 22
22 -
 23
23 -
 24
24 -
 25
25 -
 26
26 -
 27
27 -
 28
28 -
 29
29 -
 30
30 -
 31
31 -
32
-
33
-
34
-
35
-
36
-
37
-
38
-
39
-
40
-
41
-
42
-
43
-
44
-
45
-
46
-
47
-
48
-
49
-
50
-
51
-
52
-
53
-
54
-
55
-
56
-
57
-
58
-
59
-
60
-
61
-
62
-
63
-
64
-
65
-
66
-
67
-
68
-
69
-
70
-
71
-
72
-
73
-
74
-
75
-
76
-
77
-
78
-
79
-
80
-
81
-
82
-
83
-
84
-
85
-
86
-
87
-
88
-
89
-
90
-
91
-
92
-
93
-
94
-
95
-
96
-
97
-
98
-
99
-
100
-
101
-
102
-
103
-
104
-
105
-
106
-
107
-
108
-
109
-
110
-
111
-
112
-
113
-
114
-
115
-
116
-
117
-
118
-
119
-
120
-
121
-
122
-
123
-
124
-
125
-
126
-
127
-
128
-
129
-
130
-
131
-
132
-
133
-
134
-
135
-
136
-
137
-
138
-
139
-
140
-
141
-
142
-
143
-
144
-
145
-
146
-
147
-
148
-
149
-
150
-
151
-
152
-
153
-
154
-
155
-
156
 |
 |

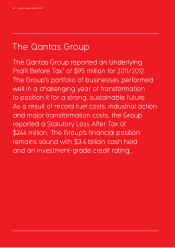
FOR THE YEAR ENDED 30 JUNE 2012
Review of Operations continued
7 Based on Normalised EBIT for Qantas Frequent Flyer for the year ended 30 June 2011 of $202 million. Qantas Frequent Flyer Underlying EBIT is normalised for prior period
changes in accounting estimates. Refer to page 24 for a reconciliation of Qantas Frequent Flyer’s normalised result to Underlying EBIT.
8 Source: June 2012 BITRE data, Qantas most on time major domestic airline for jet operations greater than 10,000 sectors.
9 2012 Australian Federation of Travel Agents National Industry Awards.
10 2012 Air Transport World (ATW) awards.
11 Large market corporate accounts.
12 Underlying operating expenses (excluding fuel), fuel and net finance costs differ from equivalent statutory expenses due to items excluded from Underlying PBT, such as adjustments
for impacts of AASB 139 which relate to other reporting periods and other items identified by Management. Refer to page 25 for a reconciliation of Statutory and Underlying PBT.
13 ASK – total number of seats available for passengers, multiplied by the number of kilometres flown.
14 RPK – total number of passengers carried, multiplied by the number of kilometres flown.
15 Yield and unit cost calculations are adjusted to treat fee revenue from Jetstar product bundles (launched in May 2011) as passenger revenue to ensure comparability between periods.
16 Net Underlying Unit Cost – Underlying PBT less Passenger Revenue, fuel and Frequent Flyer change in accounting estimate per ASK.
17 Comparable Unit Cost – Net Underlying Unit Cost adjusted for the impact of industrial action (2011/2012) and natural disasters (2010/2011) and movements in average sector length.
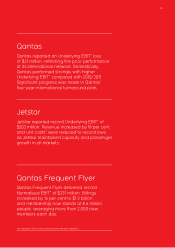
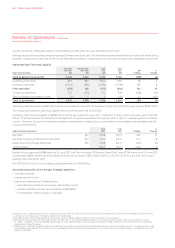
Qantas was the most on-time domestic airline8. Qantas’ domestic network9 and QantasLink10 were awarded Airline of the Year in their
respective categories and Qantas domestic customer satisfaction is at its highest level in over three years. Qantas remains the airline
of choice for corporate travellers with strong double digit corporate travel revenue growth. During the year 171 large-market corporate
accounts were renewed and 48 new accounts11 added, including nine won back as preferred airline.
Jetstar achieved a record Underlying EBIT of $203 million. Jetstar delivered capacity growth of 14 per cent in 2011/2012 and improved
Underlying EBIT by 20 per cent. On 3 July 2012, Jetstar Japan was successfully launched five months ahead of schedule.
Qantas Frequent Flyer also delivered a record performance7 with Underlying EBIT of $231 million up 14 per cent on prior year Normalised
EBIT7. This result was achieved through 9 per cent member growth, increased partner engagement and enhanced product offerings.
As Australia’s leading loyalty program, membership continues to grow averaging more than 2,000 new members per day.
The performance of Qantas’ international network weighed heavily on the Group’s result. The impact of industrial action, negative
global economic factors, an increase in fuel costs and a high Australian dollar have resulted in a decline in Underlying EBIT compared
to prior year. Savings generated by the Qantas International Transformation program are expected to drive improvements in future results.
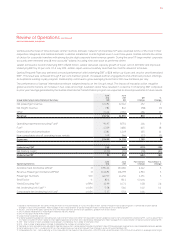
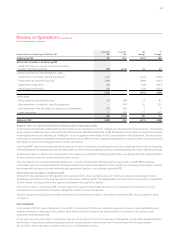
Group Underlying Income Statement Summary
June
2012
$M
June
2011
$M
$M
Change
%
Change
Net passenger revenue , ,
Net freight revenue () ()
Other , ,
Revenue , ,
Operating expenses (excluding Fuel)12 , ,
Fuel12 , ,
Depreciation and amortisation , ,
Non-cancellable aircraft operating lease rentals () ()
Expenses , , ,
Underlying EBIT () ()
Net finance costs12 () () () ()
Underlying PBT () ()
Operating Statistics
June
2012
June
2011
Fav/(Unfav)
Change
Fav/(Unfav) %
Change
Available Seat Kilometres (ASKs)13 M , , ,
Revenue Passenger Kilometres (RPKs)14 M , , ,
Passenger Numbers ‘ , , ,
Seat Factor % . . . pts -
Yield (Excluding FX)15 c/RPK . . . .
Net Underlying Unit Cost15, 16 c/ASK . . . .
Comparable Net Underlying Unit Cost16 c/ASK . . .
019