Qantas 2012 Annual Report Download - page 86
Download and view the complete annual report
Please find page 86 of the 2012 Qantas annual report below. You can navigate through the pages in the report by either clicking on the pages listed below, or by using the keyword search tool below to find specific information within the annual report.-
 1
1 -
2
-
3
-
4
-
5
-
6
-
7
-
8
-
9
-
10
-
11
-
12
-
13
-
14
-
15
-
16
-
17
-
18
-
19
-
20
-
21
-
22
-
23
-
24
-
25
-
26
-
27
-
28
-
29
-
30
-
31
-
32
-
33
-
34
-
35
-
36
-
37
-
38
-
39
-
40
-
41
-
42
-
43
-
44
-
45
-
46
-
47
-
48
-
49
-
50
-
51
-
52
-
53
-
54
-
55
-
56
-
57
-
58
-
59
-
60
-
61
-
62
-
63
-
64
-
65
-
66
-
67
-
68
-
69
-
70
-
71
-
72
-
73
-
74
-
75
-
 76
76 -
 77
77 -
 78
78 -
 79
79 -
 80
80 -
 81
81 -
 82
82 -
 83
83 -
 84
84 -
 85
85 -
 86
86 -
 87
87 -
 88
88 -
 89
89 -
 90
90 -
 91
91 -
 92
92 -
 93
93 -
 94
94 -
 95
95 -
 96
96 -
97
-
98
-
99
-
100
-
101
-
102
-
103
-
104
-
105
-
106
-
107
-
108
-
109
-
110
-
111
-
112
-
113
-
114
-
115
-
116
-
117
-
118
-
119
-
120
-
121
-
122
-
123
-
124
-
125
-
126
-
127
-
128
-
129
-
130
-
131
-
132
-
133
-
134
-
135
-
136
-
137
-
138
-
139
-
140
-
141
-
142
-
143
-
144
-
145
-
146
-
147
-
148
-
149
-
150
-
151
-
152
-
153
-
154
-
155
-
156
 |
 |

FOR THE YEAR ENDED 30 JUNE 2012
Notes to the Financial Statements continued
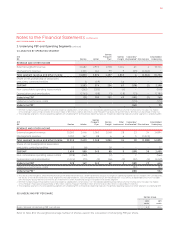
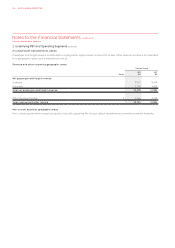
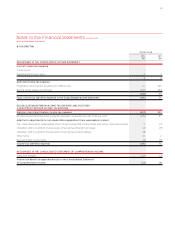
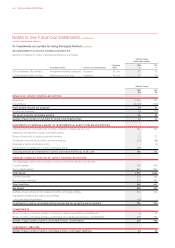
F ANALYSIS BY GEOGRAPHICAL AREAS
Passenger and freight revenue is attributed to a geographic region based on the point of sale. Other revenue/income is not allocated
to a geographic region as it is impractical to do so.
Revenue and other income by geographic areas
Qantas Group
Notes
2012
$M
2011
$M
Net passenger and freight revenue
Australia , ,
Overseas , ,
Total net passenger and freight revenue , ,
Other revenue/income , ,
Total revenue and other income , ,
Non-current assets by geographic areas
Non-current assets which consist principally of aircraft supporting the Groups’ global operations are primarily located in Australia.
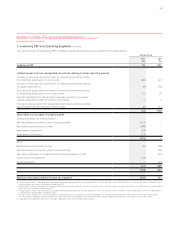
2. Underlying PBT and Operating Segments continued
QANTAS ANNUAL REPORT 2012084