Qantas 2012 Annual Report Download - page 25
Download and view the complete annual report
Please find page 25 of the 2012 Qantas annual report below. You can navigate through the pages in the report by either clicking on the pages listed below, or by using the keyword search tool below to find specific information within the annual report.-
 1
1 -
2
-
3
-
4
-
5
-
6
-
7
-
8
-
9
-
10
-
11
-
12
-
13
-
14
-
 15
15 -
 16
16 -
 17
17 -
 18
18 -
 19
19 -
 20
20 -
 21
21 -
 22
22 -
 23
23 -
 24
24 -
 25
25 -
 26
26 -
 27
27 -
 28
28 -
 29
29 -
 30
30 -
 31
31 -
 32
32 -
 33
33 -
 34
34 -
 35
35 -
36
-
37
-
38
-
39
-
40
-
41
-
42
-
43
-
44
-
45
-
46
-
47
-
48
-
49
-
50
-
51
-
52
-
53
-
54
-
55
-
56
-
57
-
58
-
59
-
60
-
61
-
62
-
63
-
64
-
65
-
66
-
67
-
68
-
69
-
70
-
71
-
72
-
73
-
74
-
75
-
76
-
77
-
78
-
79
-
80
-
81
-
82
-
83
-
84
-
85
-
86
-
87
-
88
-
89
-
90
-
91
-
92
-
93
-
94
-
95
-
96
-
97
-
98
-
99
-
100
-
101
-
102
-
103
-
104
-
105
-
106
-
107
-
108
-
109
-
110
-
111
-
112
-
113
-
114
-
115
-
116
-
117
-
118
-
119
-
120
-
121
-
122
-
123
-
124
-
125
-
126
-
127
-
128
-
129
-
130
-
131
-
132
-
133
-
134
-
135
-
136
-
137
-
138
-
139
-
140
-
141
-
142
-
143
-
144
-
145
-
146
-
147
-
148
-
149
-
150
-
151
-
152
-
153
-
154
-
155
-
156
 |
 |

FOR THE YEAR ENDED 30 JUNE 2012
Review of Operations continued
23 Ancillary revenue per passenger.
24 Unit cost – Jetstar unit cost is measured based on controllable unit cost. Controllable unit cost is calculated as total expenses excluding fuel per ASK.
25 CAGR – Compound Annual Growth Rate.
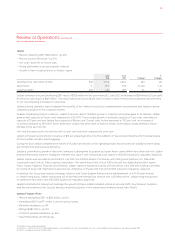
Jetstar
— Record Underlying EBIT $203 million, up 20%
— Record Ancillary Revenue23 up 27%
— Unit cost24 down 2% to record lows
— Strong performance across domestic network
— Growth in Asia including launch of Jetstar Japan
June
2012
June
2011 Change
%
Change
Total Revenue and Other Income $M , ,
Seat Factor % . . . pts .
Underlying EBIT $M
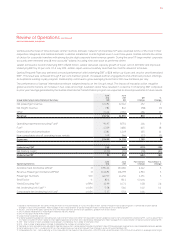
Jetstar achieved a record Underlying EBIT result of $203 million for the year ended 30 June 2012, an increase of $34 million (20 per cent)
on the prior year result of $169 million. This result was driven by an 18 per cent increase in total revenue and sustained improvements
in unit cost offsetting increases in fuel prices.
Jetstar’s strong domestic results highlight the benefits of the Qantas Group’s two complementary flying brands and Jetstar’s strong
competitive position in the Australian market.
Despite challenging market conditions, Jetstar has been able to maintain growth in capacity and passengers in all markets. Jetstar
grew overall capacity by 14 per cent compared to 2010/2011. This includes growth in domestic capacity of 7 per cent, international
capacity of 12 per cent and Jetstar Asia capacity of 38 per cent. Overall, seat factors improved to 79.2 per cent, an increase of
1.4 points compared to 2010/2011. At the same time, Jetstar has been able to improve yields, most notably across domestic leisure
markets in the second half.
Unit cost has improved to record lows with a 2 per cent reduction compared to prior year.
Jetstar achieved record ancillary revenue of $31 per passenger driven by the addition of new product streams and increased sales
of fare bundles and pre-paid baggage.
During the year Jetstar completed the retrofit of 32 A320 aircraft with a new lightweight seat that provided an additional three seats
per aircraft and improved fuel efficiency.
Jetstar is committed to growth in Asia and continues to strengthen its position as a pan-Asian carrier. Within Asia, there are now Jetstar
branded franchises based in Singapore, Vietnam and Japan, with Hong Kong to be added in 2012/2013 subject to regulatory approval.
Jetstar Japan was successfully launched in July 2012, five months ahead of schedule, with strong local partners JAL, Mitsubishi
Corporation and Century Tokyo Leasing Corporation. The airline has a fleet of four A320s flying to five destinations within Japan:
Tokyo, Osaka, Sapporo, Fukuoka and Okinawa. Jetstar Japan is expected to grow to 13 aircraft by June 2013 with funding committed
for a total of 24 aircraft. International services will commence in the second half of 2012/2013 subject to regulatory approval.
In addition, the Group has formed a strategic alliance with China Eastern Airlines for the establishment of a 50:50 joint venture
in Jetstar Hong Kong. Jetstar Hong Kong will be the first ever foreign joint venture with a Chinese airline. Jetstar Hong Kong plans
to commence services in late 2012/2013 (subject to regulatory approval).
Jetstar’s international network will leverage the growth of these Jetstar branded airlines to provide traffic flow between Australia
and Asia and reinforce the Group’s strong competitive position in the leisure travel markets across Asia-Pacific.
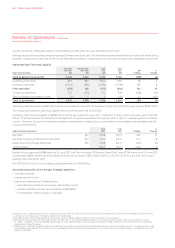
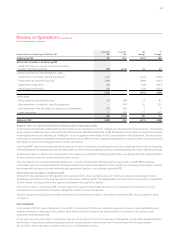
Qantas Frequent Flyer
— Record Normalised EBIT of $231 million, up 14%
— Normalised EBIT CAGR25 of 16% over the last four years
— 8.6 million members, up 9%
— Billings $1,187 million, up 14%
— 5.1 million awards redeemed, up 16%
— New Partnerships and Products
023