Qantas 2012 Annual Report Download - page 130
Download and view the complete annual report
Please find page 130 of the 2012 Qantas annual report below. You can navigate through the pages in the report by either clicking on the pages listed below, or by using the keyword search tool below to find specific information within the annual report.-
 1
1 -
2
-
3
-
4
-
5
-
6
-
7
-
8
-
9
-
10
-
11
-
12
-
13
-
14
-
15
-
16
-
17
-
18
-
19
-
20
-
21
-
22
-
23
-
24
-
25
-
26
-
27
-
28
-
29
-
30
-
31
-
32
-
33
-
34
-
35
-
36
-
37
-
38
-
39
-
40
-
41
-
42
-
43
-
44
-
45
-
46
-
47
-
48
-
49
-
50
-
51
-
52
-
53
-
54
-
55
-
56
-
57
-
58
-
59
-
60
-
61
-
62
-
63
-
64
-
65
-
66
-
67
-
68
-
69
-
70
-
71
-
72
-
73
-
74
-
75
-
76
-
77
-
78
-
79
-
80
-
81
-
82
-
83
-
84
-
85
-
86
-
87
-
88
-
89
-
90
-
91
-
92
-
93
-
94
-
95
-
96
-
97
-
98
-
99
-
100
-
101
-
102
-
103
-
104
-
105
-
106
-
107
-
108
-
109
-
110
-
111
-
112
-
113
-
114
-
115
-
116
-
117
-
118
-
119
-
 120
120 -
 121
121 -
 122
122 -
 123
123 -
 124
124 -
 125
125 -
 126
126 -
 127
127 -
 128
128 -
 129
129 -
 130
130 -
 131
131 -
 132
132 -
 133
133 -
 134
134 -
 135
135 -
 136
136 -
 137
137 -
 138
138 -
 139
139 -
 140
140 -
141
-
142
-
143
-
144
-
145
-
146
-
147
-
148
-
149
-
150
-
151
-
152
-
153
-
154
-
155
-
156
 |
 |
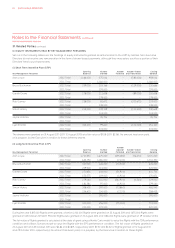
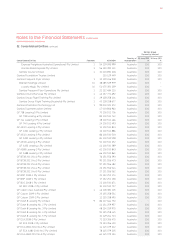
FOR THE YEAR ENDED 30 JUNE 2012
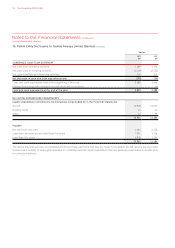
Notes to the Financial Statements continued
Qantas Group
Profit Before Tax Equity (Before Tax)
2012
$M
2011
$M
2012
$M
2011
$M
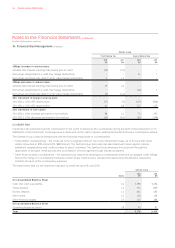
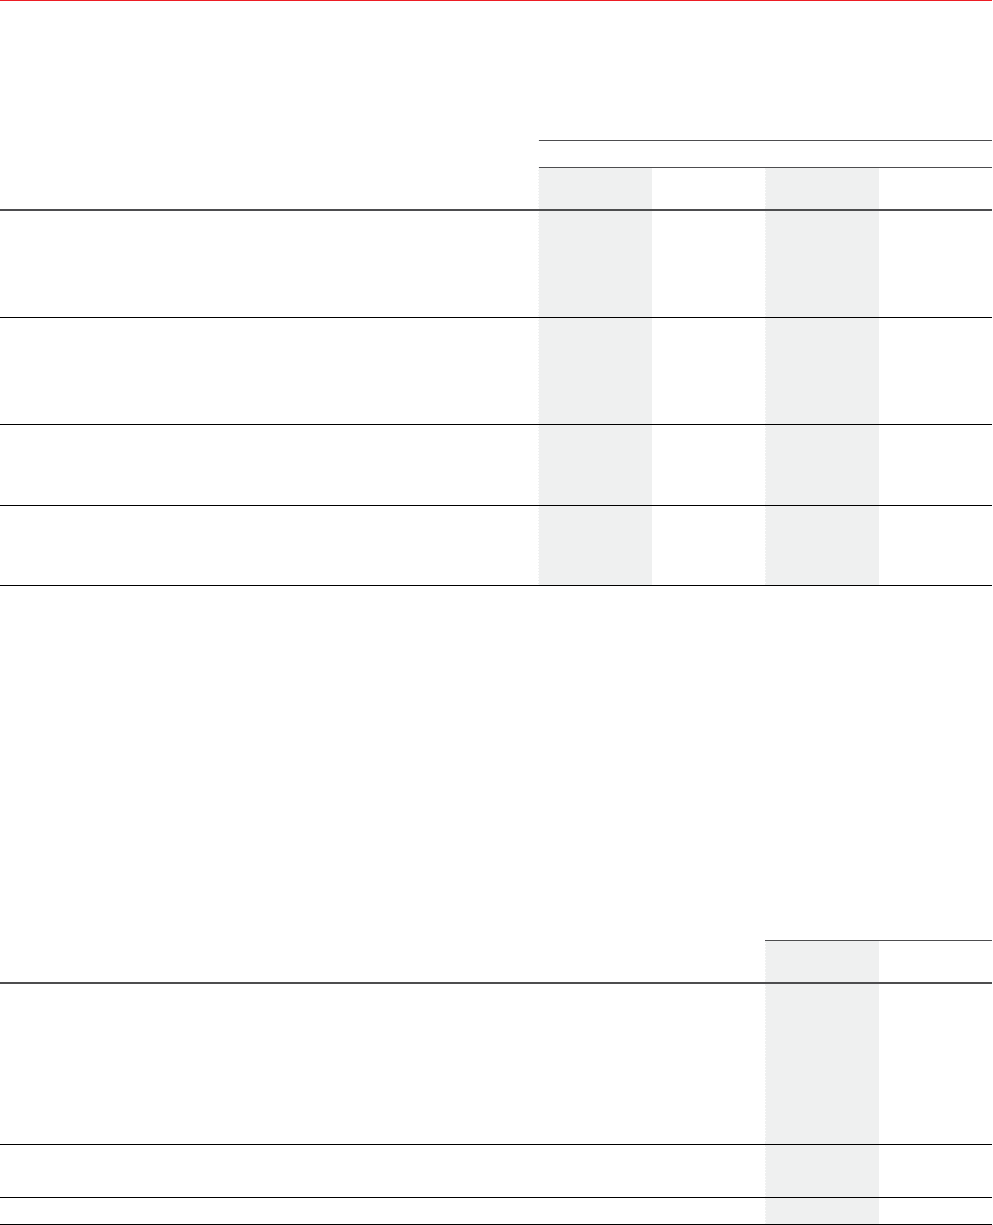
bps increase in interest rates
Variable rate interest-bearing instruments (net of cash) () () – –
Derivatives designated in a cash flow hedge relationship – –
Derivatives and fixed rate debt in a fair value hedge relationship – –
bps decrease in interest rates
Variable rate interest-bearing instruments (net of cash) – –
Derivatives designated in a cash flow hedge relationship – – ()
Derivatives and fixed rate debt in a fair value hedge relationship () () – –
% movement in foreign currency pairs
% (: %) USD depreciation () () () ()
% (: %) USD appreciation
% movement in fuel indices
% (: %) increase per barrel in fuel indices
% (: %) decrease per barrel in fuel indices () () () ()
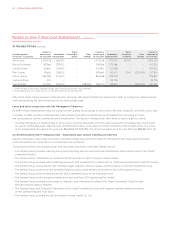
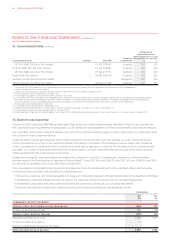
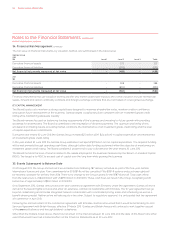
(C) CREDIT RISK
Credit risk is the potential loss from a transaction in the event of default by the counterparty during the term of the transaction or on
settlement of the transaction. Credit exposure is measured as the cost to replace existing transactions should a counterparty default.
The Qantas Group conducts transactions with the following major types of counterparties:
— Trade debtor counterparties – the credit risk is the recognised amount, net of any impairment losses. As at 30 June 2012 trade
debtor amounted to $794 million (2011: $839 million). The Qantas Group has credit risk associated with travel agents, industry
settlement organisations and credit provided to direct customers. The Qantas Group minimises this credit risk through the
application of stringent credit policies and accreditation of travel agents through industry programs
— Other financial asset counterparties – the Qantas Group restricts its dealings to counterparties that have acceptable credit ratings.
Should the rating of a counterparty fall below certain levels, internal policy dictates that approval by the Board is required to
maintain the level of the counterparty exposure
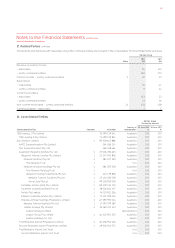
The table below sets out the maximum exposure to credit risk as at 30 June 2012:
Qantas Group
Notes
2012
$M
2011
$M
On Consolidated Balance Sheet
Cash and cash equivalents , ,
Trade debtors
Sundry debtors
Other loans
Other financial assets
Off Consolidated Balance Sheet
Operating leases as lessor
Total , ,
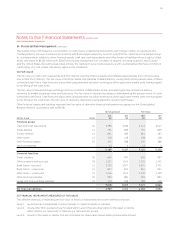
34. Financial Risk Management continued
QANTAS ANNUAL REPORT 2012128