Qantas 2012 Annual Report Download - page 150
Download and view the complete annual report
Please find page 150 of the 2012 Qantas annual report below. You can navigate through the pages in the report by either clicking on the pages listed below, or by using the keyword search tool below to find specific information within the annual report.-
 1
1 -
2
-
3
-
4
-
5
-
6
-
7
-
8
-
9
-
10
-
11
-
12
-
13
-
14
-
15
-
16
-
17
-
18
-
19
-
20
-
21
-
22
-
23
-
24
-
25
-
26
-
27
-
28
-
29
-
30
-
31
-
32
-
33
-
34
-
35
-
36
-
37
-
38
-
39
-
40
-
41
-
42
-
43
-
44
-
45
-
46
-
47
-
48
-
49
-
50
-
51
-
52
-
53
-
54
-
55
-
56
-
57
-
58
-
59
-
60
-
61
-
62
-
63
-
64
-
65
-
66
-
67
-
68
-
69
-
70
-
71
-
72
-
73
-
74
-
75
-
76
-
77
-
78
-
79
-
80
-
81
-
82
-
83
-
84
-
85
-
86
-
87
-
88
-
89
-
90
-
91
-
92
-
93
-
94
-
95
-
96
-
97
-
98
-
99
-
100
-
101
-
102
-
103
-
104
-
105
-
106
-
107
-
108
-
109
-
110
-
111
-
112
-
113
-
114
-
115
-
116
-
117
-
118
-
119
-
120
-
121
-
122
-
123
-
124
-
125
-
126
-
127
-
128
-
129
-
130
-
131
-
132
-
133
-
134
-
135
-
136
-
137
-
138
-
139
-
 140
140 -
 141
141 -
 142
142 -
 143
143 -
 144
144 -
 145
145 -
 146
146 -
 147
147 -
 148
148 -
 149
149 -
 150
150 -
 151
151 -
 152
152 -
 153
153 -
 154
154 -
 155
155 -
 156
156
 |
 |

Sustainability Statistics and Notes continued
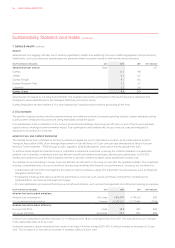
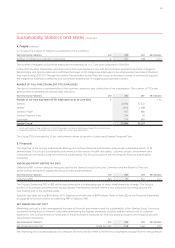
FREE CASH FLOW
Free cash flow is a measure of financial performance calculated as operating cash flows net of investing cash flows. The Group has
reported negative free cash flow since 2009 due to the significant investment in fleet renewal. The Group reported positive free cash
flow for the second half of 2011/2012 and is targeting positive free cash flow going forward reflecting that the Group’s fleet renewal
program is substantially complete and focus has turned to deleveraging and strengthening the Group’s credit metrics.
Key Performance Indicators Unit 2012 2011 GRI Indicator
Free Cash Flow $M () () EC
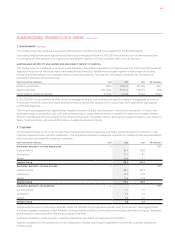
AVERAGE FLEET AGE
Long–term fleet planning is essential to aviation success. Investing in new aircraft drives improvements in safety, passenger comfort,
cost, fuel efficiency, noise, emissions, freight capacity and range capability. Monitoring the average passenger fleet age assists the
Group to manage its long-term capital requirement. The Group’s priority is renewal of its scheduled passenger aircraft fleet, which
will directly improve customer experience and fuel efficiency.
The Group’s fleet strategy supports the Group’s objectives of growth and provides for long-term fleet renewal and simplification.
In balancing these, the Group’s average fleet age will remain in the range of eight to ten years over the long term.
Key Performance Indicators Unit 2012 2011 GRI Indicator
Average fleet age – scheduled passenger fleet Years . . –
Reduction of the Group’s fleet age was due to retirement of older aircraft and replacement through acquisition of new aircraft.
In 2011/2012 seven aircraft were retired from the Boeing 737-400 fleet, five from the B747-400 fleet and two from the B767-300 fleet.
Acquisitions included two Airbus A380-800s, two A330-200s, seven A320-200s, thirteen B737-800s, three Bombardier Q400s, two B717s,
ten F100s and three ex-leased B767-300s.
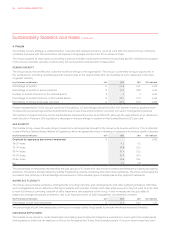
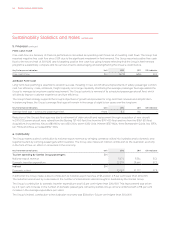
6. Community
The Group makes a direct contribution to national export revenue by bringing overseas visitors into Australia and to domestic and
regional tourism by carrying passengers within Australia. The Group also makes an indirect contribution to the Australian economy
in the form of flow-on effect on all sectors in the economy.
Key Performance Indicators Unit 2012 2011 GRI Indicator
Tourism spending by Qantas Group passengers $M
National export revenue , , EC
Domestic traveller expenditure , , EC
Indirect $M
Economic output , , EC
In 2011/2012, the Group made a direct contribution to national export revenue of $5.4 billion, 2.9 per cent lower than 2010/2011.
The reduction was driven by a decrease in the number of international visitors brought to Australia by the Qantas Group.
The Group’s contribution to domestic traveller expenditure was 13.3 per cent higher than 2010/2011. This improvement was driven
by a 3.1 per cent increase in the number of domestic passengers carried by Qantas Group carriers combined with a 9.8 per cent
increase in the average expenditure per visitor.
The Group’s indirect contribution to the Australian economy was $33 billion, 5.6 per cent higher than 2010/2011.
5. Financial continued
QANTAS ANNUAL REPORT 2012148