Qantas 2012 Annual Report Download - page 144
Download and view the complete annual report
Please find page 144 of the 2012 Qantas annual report below. You can navigate through the pages in the report by either clicking on the pages listed below, or by using the keyword search tool below to find specific information within the annual report.-
 1
1 -
2
-
3
-
4
-
5
-
6
-
7
-
8
-
9
-
10
-
11
-
12
-
13
-
14
-
15
-
16
-
17
-
18
-
19
-
20
-
21
-
22
-
23
-
24
-
25
-
26
-
27
-
28
-
29
-
30
-
31
-
32
-
33
-
34
-
35
-
36
-
37
-
38
-
39
-
40
-
41
-
42
-
43
-
44
-
45
-
46
-
47
-
48
-
49
-
50
-
51
-
52
-
53
-
54
-
55
-
56
-
57
-
58
-
59
-
60
-
61
-
62
-
63
-
64
-
65
-
66
-
67
-
68
-
69
-
70
-
71
-
72
-
73
-
74
-
75
-
76
-
77
-
78
-
79
-
80
-
81
-
82
-
83
-
84
-
85
-
86
-
87
-
88
-
89
-
90
-
91
-
92
-
93
-
94
-
95
-
96
-
97
-
98
-
99
-
100
-
101
-
102
-
103
-
104
-
105
-
106
-
107
-
108
-
109
-
110
-
111
-
112
-
113
-
114
-
115
-
116
-
117
-
118
-
119
-
120
-
121
-
122
-
123
-
124
-
125
-
126
-
127
-
128
-
129
-
130
-
131
-
132
-
133
-
 134
134 -
 135
135 -
 136
136 -
 137
137 -
 138
138 -
 139
139 -
 140
140 -
 141
141 -
 142
142 -
 143
143 -
 144
144 -
 145
145 -
 146
146 -
 147
147 -
 148
148 -
 149
149 -
 150
150 -
 151
151 -
 152
152 -
 153
153 -
 154
154 -
155
-
156
 |
 |

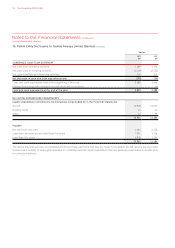
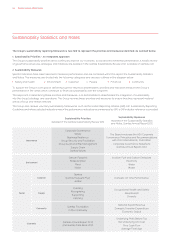
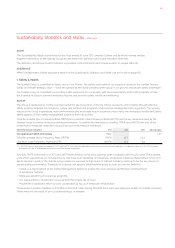
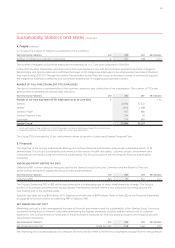
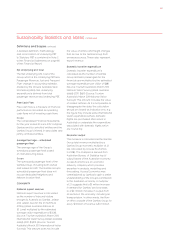
Sustainability Statistics and Notes
The Group’s sustainability reporting framework is two-fold to represent the priorities and measures identified, as outlined below.
1. Sustainability Priorities - An Integrated Approach
The Group’s sustainability priorities are to continually improve our economic, social and environmental performance. A holistic review
of governance structures, strategies and initiatives are detailed in the Qantas Sustainability Review 2012, available on qantas.com.
2. Sustainability Measures
Specific indicators have been selected to measure performance and are contained within this report, the Sustainability Statistics
and Notes. The measures are divided into the following categories and are also outlined in the diagram below:
1 Safety and Health 2 Environment 3 Customer 4 People 5 Financial 6 Community
To support the Group’s core goal of delivering superior returns to shareholders, priorities and indicators measure the Group’s
performance in the areas which contribute to financial sustainability over the long term.
The approach in determining these priorities and measures, is to demonstrate to stakeholders the integration of sustainability
into the Group’s strategy and operations. The Group reviews these priorities and measures to ensure that they represent material
areas of focus and remain relevant.
The Group also reviews voluntary sustainability frameworks, such as the Global Reporting Initiative (GRI) G3.1 Sustainability Reporting
Guidelines and where selected indicators match the performance indicators recommended by GRI, a GRI indicator reference is provided.
Sustainability Priorities
detailed in the Qantas Sustainability Review 2012
Sustainability Measures
reported in the Sustainability Statistics
and Notes, Qantas Annual Report 2012
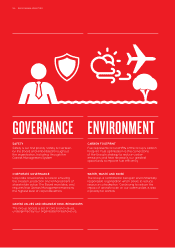
Governance
Corporate Governance
Safety
Business Resilience
Group Security and Facilitation
Group Audit and Risk Management
Supply Chain
Qantas Values
The Board endorses the ASX Corporate
Governance Principles and Recommendations
with Amendments, nd Edition
Corporate Governance Statement
Qantas Annual Report
Environment
Carbon Footprint
Waste & Water
Fleet
Noise
Aviation Fuel and Carbon Emissions
Electricity
Water
Waste
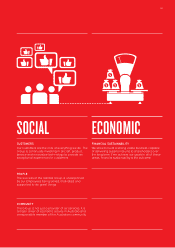
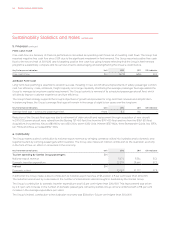
Social
Customer
Qantas
Qantas Frequent Flyer
Jetstar
Domestic On-time Performance
People
Investing
Recognising
Supporting
Listening
Occupational Health and Safety
Absenteeism
Diversity
Community Qantas Foundation
In the Community
National Export Revenue
Domestic Traveller Expenditure
Economic Output
Economic Qantas Annual Report
and Qantas Data Book
Underlying Profit Before Tax
Net Underlying Unit Cost
Free Cash Flow
Average Fleet Age
QANTAS ANNUAL REPORT 2012142