Qantas 2012 Annual Report Download - page 83
Download and view the complete annual report
Please find page 83 of the 2012 Qantas annual report below. You can navigate through the pages in the report by either clicking on the pages listed below, or by using the keyword search tool below to find specific information within the annual report.-
 1
1 -
2
-
3
-
4
-
5
-
6
-
7
-
8
-
9
-
10
-
11
-
12
-
13
-
14
-
15
-
16
-
17
-
18
-
19
-
20
-
21
-
22
-
23
-
24
-
25
-
26
-
27
-
28
-
29
-
30
-
31
-
32
-
33
-
34
-
35
-
36
-
37
-
38
-
39
-
40
-
41
-
42
-
43
-
44
-
45
-
46
-
47
-
48
-
49
-
50
-
51
-
52
-
53
-
54
-
55
-
56
-
57
-
58
-
59
-
60
-
61
-
62
-
63
-
64
-
65
-
66
-
67
-
68
-
69
-
70
-
71
-
72
-
 73
73 -
 74
74 -
 75
75 -
 76
76 -
 77
77 -
 78
78 -
 79
79 -
 80
80 -
 81
81 -
 82
82 -
 83
83 -
 84
84 -
 85
85 -
 86
86 -
 87
87 -
 88
88 -
 89
89 -
 90
90 -
 91
91 -
 92
92 -
 93
93 -
94
-
95
-
96
-
97
-
98
-
99
-
100
-
101
-
102
-
103
-
104
-
105
-
106
-
107
-
108
-
109
-
110
-
111
-
112
-
113
-
114
-
115
-
116
-
117
-
118
-
119
-
120
-
121
-
122
-
123
-
124
-
125
-
126
-
127
-
128
-
129
-
130
-
131
-
132
-
133
-
134
-
135
-
136
-
137
-
138
-
139
-
140
-
141
-
142
-
143
-
144
-
145
-
146
-
147
-
148
-
149
-
150
-
151
-
152
-
153
-
154
-
155
-
156
 |
 |

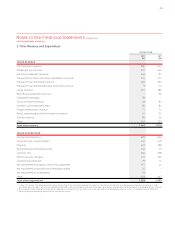
FOR THE YEAR ENDED 30 JUNE 2012
Notes to the Financial Statements continued
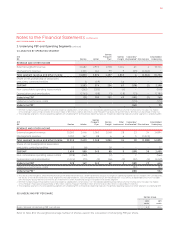
C ANALYSIS BY OPERATING SEGMENT
2012
$M Qantas Jetstar
Qantas
Frequent
Flyer
Qantas
Freight
Corporate/
Unallocated2Eliminations
Consolidated
Underlying
REVENUE AND OTHER INCOME
External segment revenue , , , , ,
Intersegment revenue , () (,) –
Total segment revenue and other income , , , , (,) ,
Share of net profit/(loss) of associates
and jointly controlled entities () – – –
EBITDAR1, () () ,
Non-cancellable operating lease rentals () () – () – – ()
Depreciation and amortisation (,) () () () () – (,)
Underlying EBIT () () ()
Underlying net finance costs () ()
Underlying PBT2()
1 EBITDAR (Underlying earnings before income tax expense, depreciation, amortisation, non-cancellable operating lease rentals and net finance costs) includes the impact
of the change in accounting estimates for discount rates of $30 million (Qantas $30 million), and Frequent Flyer accounting (Eliminations $5 million) as described in Note 1(c).
2 The Corporate segment is the only operating segment with Underlying PBT as the primary reporting measure. The primary reporting measure of other segments is Underlying EBIT.
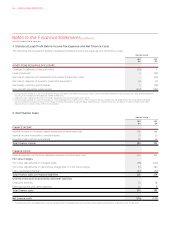
2011
$M Qantas Jetstar
Qantas
Frequent
Flyer
Qantas
Freight
Other
businesses1
Corporate/
Unallocated3Eliminations
Consolidated
Underlying
REVENUE AND OTHER INCOME
External segment revenue , , , , ,
Intersegment revenue , (,) –
Total segment revenue and other income , , , , (,) ,
Share of net (loss)/profit of associates
and jointly controlled entities () – – – –
EBITDAR2, () ,
Non-cancellable operating lease rentals () () – () – – ()
Depreciation and amortisation (,) () () () () () () (,)
Underlying EBIT ()
Underlying net finance costs () ()
Underlying PBT3()
1 As a result of the merger of Jetset Travelworld Group with Stella Travel Services, Jetset Travelworld Group is no longer an operating segment as of 1 October 2010. Consequently,
the results of the Jetset Travelworld Group segment for the year ended 30 June 2011 represent the results for the period from 1 July 2010 to 30 September 2010. From 1 October
2010, the equity accounted result of the Group’s investment in Jetset Travelworld Group is included in the Qantas segment.
2 EBITDAR (Underlying earnings before income tax expense, depreciation, amortisation, non-cancellable operating lease rentals and net finance costs) includes the impact
of the Frequent Flyer accounting estimate of $172 million (Qantas Frequent Flyer $140 million and Eliminations $32 million) as described in Note 1(c).
3 The Corporate segment is the only operating segment with Underlying PBT as the primary reporting measure. The primary reporting measure of other segments is Underlying EBIT.
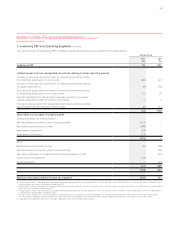
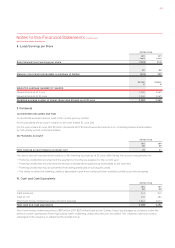
D UNDERLYING PBT PER SHARE
Qantas Group
2012
cents
2011
cents
Basic/diluted Underlying PBT per share 4.2 24.4
Refer to Note 8 for the weighted average number of shares used in the calculation of Underlying PBT per share.
2. Underlying PBT and Operating Segments continued
081