Qantas 2012 Annual Report Download - page 146
Download and view the complete annual report
Please find page 146 of the 2012 Qantas annual report below. You can navigate through the pages in the report by either clicking on the pages listed below, or by using the keyword search tool below to find specific information within the annual report.-
 1
1 -
2
-
3
-
4
-
5
-
6
-
7
-
8
-
9
-
10
-
11
-
12
-
13
-
14
-
15
-
16
-
17
-
18
-
19
-
20
-
21
-
22
-
23
-
24
-
25
-
26
-
27
-
28
-
29
-
30
-
31
-
32
-
33
-
34
-
35
-
36
-
37
-
38
-
39
-
40
-
41
-
42
-
43
-
44
-
45
-
46
-
47
-
48
-
49
-
50
-
51
-
52
-
53
-
54
-
55
-
56
-
57
-
58
-
59
-
60
-
61
-
62
-
63
-
64
-
65
-
66
-
67
-
68
-
69
-
70
-
71
-
72
-
73
-
74
-
75
-
76
-
77
-
78
-
79
-
80
-
81
-
82
-
83
-
84
-
85
-
86
-
87
-
88
-
89
-
90
-
91
-
92
-
93
-
94
-
95
-
96
-
97
-
98
-
99
-
100
-
101
-
102
-
103
-
104
-
105
-
106
-
107
-
108
-
109
-
110
-
111
-
112
-
113
-
114
-
115
-
116
-
117
-
118
-
119
-
120
-
121
-
122
-
123
-
124
-
125
-
126
-
127
-
128
-
129
-
130
-
131
-
132
-
133
-
134
-
135
-
 136
136 -
 137
137 -
 138
138 -
 139
139 -
 140
140 -
 141
141 -
 142
142 -
 143
143 -
 144
144 -
 145
145 -
 146
146 -
 147
147 -
 148
148 -
 149
149 -
 150
150 -
 151
151 -
 152
152 -
 153
153 -
 154
154 -
 155
155 -
 156
156
 |
 |

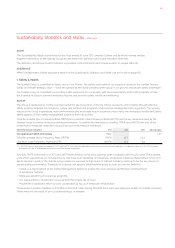
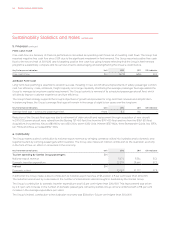
Sustainability Statistics and Notes continued
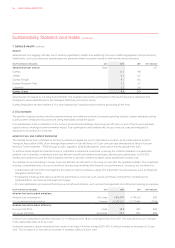
HEALTH
Absenteeism is a lagging indicator which reflects organisation health and wellbeing, the level of staff engagement and productivity.
Additionally, low injury rates and absenteeism are generally linked to positive trends in staff morale and productivity.
Key Performance Indicators Unit 2012 2011 GRI Indicator
Absenteeism per annum Days LA
Qantas . .
Jetstar . .
Qantas Freight . .
Qantas Frequent Flyer . .
Corporate . .
Qantas Group . .
Absenteeism increased by 0.3 days from 2010/2011. The business areas that contributed to this result have been identified and
analysed to allow absenteeism to be managed effectively across the Group.
Qantas employees showed resilience in a year impacted by industrial action and the grounding of the fleet.
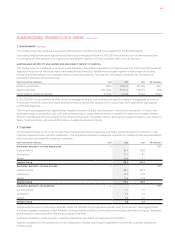
2. Environment
The growth of global aviation and the present reliance on traditional aviation fuel means growing industry carbon emissions during
a period when emissions reductions are being mandated across the globe.
Fuel optimisation is the cornerstone of the Group’s environmental strategy. Improving fuel efficiency is one of the Group’s greatest
opportunities to manage its environmental impact. Fuel optimisation also enables the Group to reduce costs and mitigate its
exposure to fluctuations in oil prices.
AVIATION FUEL AND CARBON EMISSIONS
The Qantas Group has committed to achieving ambitious targets set out for international aviation, by the International Aviation
Transport Association (IATA), of an average improvement in fuel efficiency of 1.5 per cent per year (measured as litres of fuel per
Revenue Tonne Kilometre – RTK) through to 2020, against a 2008/2009 baseline, and carbon neutral growth from 2020.
To achieve these targets the Qantas Group is committed to emissions reductions, pursuing the commercialisation of sustainable
aviation fuel in Australia, investing in more fuel efficient aircraft and engine technology, and process optimisation. In 2011/2012
Qantas and Jetstar became the first Australian airlines to operate commercial flights using sustainable aviation fuel.
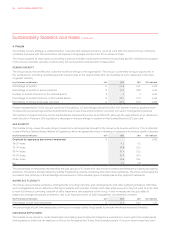
The Qantas Group is investing in newer, more fuel efficient aircraft which, in the long run, will offer the greatest benefits. This investment
is being complemented by a focus on technical and process initiatives that improve fuel performance, including, but not limited to:
— Collaboration with air traffic management providers to improve airspace usage and implement new procedures, such as Required
Navigation Performance
— Engineering initiatives that improve technical performance of aircraft, such as Ground Power Unit and Pre-Conditioned Air
implementation, and new aircraft wash techniques
— Process optimisation procedures that improve aircraft performance, such as load management and refined scheduling procedures
Key Performance Indicators Unit 2012 2011 GRI Indicator
Aviation fuel and carbon emissions
Aviation fuel consumption ’ Litres ,, ,, EN
CO-e emissions from aviation Tonnes ,, ,, EN
Aviation fuel and carbon efficiency
Fuel per RTKs Litres . . EN
CO-e per RTKs Kilograms . . EN
Aviation fuel consumption and the resulting CO2-e emissions were 1.8 per cent higher than 2010/2011. This was driven by an increase
in the associated ASKs of 3.1 per cent.
Australian domestic carbon emissions from aviation fuel were 4.4 million tonnes (2010/2011: 4.3 million tonnes) an increase of 3.0 per
cent. This increase is in-line with an increase in domestic ASKs of 3.2 per cent.
1. Safety & Health continued
QANTAS ANNUAL REPORT 2012144