Qantas 2012 Annual Report Download - page 20
Download and view the complete annual report
Please find page 20 of the 2012 Qantas annual report below. You can navigate through the pages in the report by either clicking on the pages listed below, or by using the keyword search tool below to find specific information within the annual report.-
 1
1 -
2
-
3
-
4
-
5
-
6
-
7
-
8
-
9
-
 10
10 -
 11
11 -
 12
12 -
 13
13 -
 14
14 -
 15
15 -
 16
16 -
 17
17 -
 18
18 -
 19
19 -
 20
20 -
 21
21 -
 22
22 -
 23
23 -
 24
24 -
 25
25 -
 26
26 -
 27
27 -
 28
28 -
 29
29 -
 30
30 -
31
-
32
-
33
-
34
-
35
-
36
-
37
-
38
-
39
-
40
-
41
-
42
-
43
-
44
-
45
-
46
-
47
-
48
-
49
-
50
-
51
-
52
-
53
-
54
-
55
-
56
-
57
-
58
-
59
-
60
-
61
-
62
-
63
-
64
-
65
-
66
-
67
-
68
-
69
-
70
-
71
-
72
-
73
-
74
-
75
-
76
-
77
-
78
-
79
-
80
-
81
-
82
-
83
-
84
-
85
-
86
-
87
-
88
-
89
-
90
-
91
-
92
-
93
-
94
-
95
-
96
-
97
-
98
-
99
-
100
-
101
-
102
-
103
-
104
-
105
-
106
-
107
-
108
-
109
-
110
-
111
-
112
-
113
-
114
-
115
-
116
-
117
-
118
-
119
-
120
-
121
-
122
-
123
-
124
-
125
-
126
-
127
-
128
-
129
-
130
-
131
-
132
-
133
-
134
-
135
-
136
-
137
-
138
-
139
-
140
-
141
-
142
-
143
-
144
-
145
-
146
-
147
-
148
-
149
-
150
-
151
-
152
-
153
-
154
-
155
-
156
 |
 |

FOR THE YEAR ENDED 30 JUNE 2012
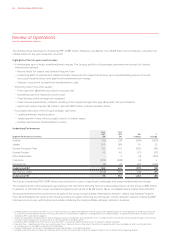
Review of Operations
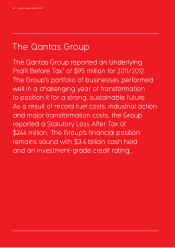
The Qantas Group reported an Underlying PBT1 of $95 million, Statutory Loss Before Tax of $349 million and a Statutory Loss after Tax
of $244 million for the year ended 30 June 2012.
Highlights of the full-year result include:
— A challenging year of major transformational change. The Group’s portfolio of businesses performed well except for Qantas’
international network:
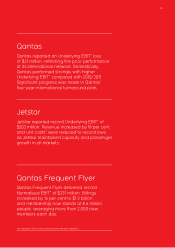
— Record result2 for Jetstar and Qantas Frequent Flyer
— Underlying EBIT3 of Qantas and Jetstar domestic networks both outperformed prior year notwithstanding impact of record
fuel costs industrial action and significant transformational change
— Statutory Loss driven by significant transformation costs
— Improving Cash Flow and Liquidity
— Free cash flow4 ($206 million) positive in second half
— Operating cash flow improved on prior year
— Fleet delivery profile strategically realigned
— Fleet renewal substantially complete resulting in the lowest average fleet age (8.3 years)5 since privatisation
— Significant surplus liquidity, $3.4 billion cash with $300 million undrawn standby facility
— Successful execution of the Group’s strategic objectives
— Leading domestic market position
— Jetstar growth in Asia, with successful launch of Jetstar Japan
— Qantas International Transformation on track
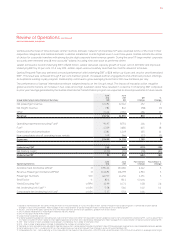
Underlying Performance
Segment Performance Summary
June
2012
$M
June
2011
$M
$M
Change
%
Change
Qantas () () >()
Jetstar
Qantas Frequent Flyer () ()
Qantas Freight () ()
Other Businesses – () ()
Corporate () () ()
Eliminations () () >()
Underlying EBIT () ()
Net finance costs6() () () ()
Underlying PBT () ()
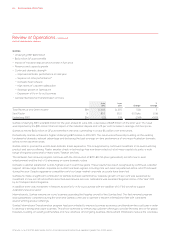
The Group’s Underlying PBT of $95 million was achieved in a year of significant challenges and major transformational change.
The industrial action and subsequent grounding in the first half of 2011/2012 had an unfavourable impact on the Group of $194 million.
In addition, in 2011/2012 the Group recorded its highest ever fuel bill of $4,329 million, 18 per cent ($645 million) higher than 2010/2011.
Strong performances were achieved by all parts of the Group except Qantas’ international network. Jetstar and Qantas Frequent
Flyer demonstrated their value to the Group’s portfolio by again achieving record results2. Overall domestic network Underlying EBIT
improved on prior year, with Qantas and Jetstar remaining the most profitable domestic airlines in Australia.
1 Underlying Profit/Loss Before Tax (PBT) is a non-statutory measure used by Management and the Group’s chief operating decision-making bodies as the primary measure
to assess the financial performance of the Group. All line items in the Review of Operations are reported on an Underlying basis. A detailed reconciliation of Statutory and
Underlying PBT is provided on page 25.
2 Jetstar result based on Underlying EBIT. Qantas Frequent Flyer result based on Normalised EBIT which is Underlying EBIT normalised for prior period changes in accounting
estimates. Refer to page 24 for a reconciliation of Normalised EBIT to Underlying EBIT.
3 Underlying Earning Before Net Finance Costs and Tax (EBIT) is the primary reporting measure for all segments except Corporate.
4 Free cash flow – Operating cash flows less investing cash flows. Free cash flow is a measure of the amount of operating cash flows available (i.e. after investing activities)
to fund reductions in net debt or payments to shareholders.
5 Average Fleet age of the Group’s scheduled passenger fleet based on manufacturing dates.
6 Underlying Net Finance Costs differ from Statutory Net Finance Costs due to adjustments for impact of AASB 139 which relate to other reporting periods.
QANTAS ANNUAL REPORT 2012018