Qantas 2012 Annual Report Download - page 149
Download and view the complete annual report
Please find page 149 of the 2012 Qantas annual report below. You can navigate through the pages in the report by either clicking on the pages listed below, or by using the keyword search tool below to find specific information within the annual report.-
 1
1 -
2
-
3
-
4
-
5
-
6
-
7
-
8
-
9
-
10
-
11
-
12
-
13
-
14
-
15
-
16
-
17
-
18
-
19
-
20
-
21
-
22
-
23
-
24
-
25
-
26
-
27
-
28
-
29
-
30
-
31
-
32
-
33
-
34
-
35
-
36
-
37
-
38
-
39
-
40
-
41
-
42
-
43
-
44
-
45
-
46
-
47
-
48
-
49
-
50
-
51
-
52
-
53
-
54
-
55
-
56
-
57
-
58
-
59
-
60
-
61
-
62
-
63
-
64
-
65
-
66
-
67
-
68
-
69
-
70
-
71
-
72
-
73
-
74
-
75
-
76
-
77
-
78
-
79
-
80
-
81
-
82
-
83
-
84
-
85
-
86
-
87
-
88
-
89
-
90
-
91
-
92
-
93
-
94
-
95
-
96
-
97
-
98
-
99
-
100
-
101
-
102
-
103
-
104
-
105
-
106
-
107
-
108
-
109
-
110
-
111
-
112
-
113
-
114
-
115
-
116
-
117
-
118
-
119
-
120
-
121
-
122
-
123
-
124
-
125
-
126
-
127
-
128
-
129
-
130
-
131
-
132
-
133
-
134
-
135
-
136
-
137
-
138
-
 139
139 -
 140
140 -
 141
141 -
 142
142 -
 143
143 -
 144
144 -
 145
145 -
 146
146 -
 147
147 -
 148
148 -
 149
149 -
 150
150 -
 151
151 -
 152
152 -
 153
153 -
 154
154 -
 155
155 -
 156
156
 |
 |

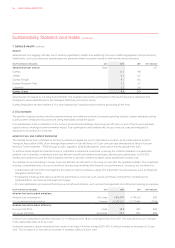
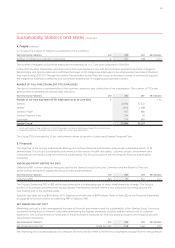
Sustainability Statistics and Notes continued
to increase the number of Indigenous Australians in the workforce.
Key Performance Indicators Unit 2012 2011 GRI Indicator
Number of Indigenous Australian employees # LA
The number of Indigenous Australian employees increased by 16, or 4.7 per cent compared to 2010/2011.
In May 2012, the third Qantas Reconciliation Action Plan was released in line with Reconciliation Australia’s elements of Respect,
Relationships and Opportunities and reaffirmed the target of 450 Indigenous employees to be employed by December 2013 which
was reset during 2010/2011. Through the Qantas Reconciliation Action Plan, the Group undertakes a range of initiatives to support
the Indigenous Australian community and to promote shared pride in Indigenous people and cultures.
NUMBER OF FULLTIME EQUIVALENT FTE EMPLOYEES
The size of a workforce is representative of the economic presence and contribution of an organisation. The number of FTEs also
gives context to absenteeism and diversity indicators.
Key Performance Indicators Unit 2012 20112GRI Indicator
Number of full-time equivalent (FTE) employees as at June # LA
Qantas , ,
Jetstar1, ,
Qantas Freight
Qantas Frequent Flyer
Corporate
Qantas Group1, ,
1 Jetstar and Qantas Group numbers for 2010/2011 have been restated to addtionally include FTEs of Jetstar Asia.
2 Comparative balances have been reclassified to align with current year presentation.
The Group FTEs increased by 1.3 per cent primarily driven by growth in Jetstar and Qantas Frequent Flyer.
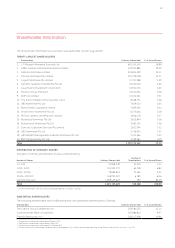
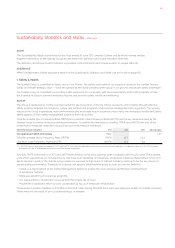
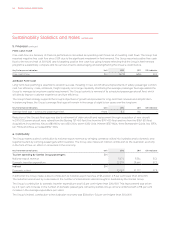
5. Financial
The objective of the Group’s sustainability strategy is to achieve financial sustainability and provide sustainable returns to its
shareholders. The Group’s sustainability performance in the areas of health and safety, customer, people, environment and
community are all linked to long-term financial sustainability. The Group focuses on the following key financial sustainability
measures:
UNDERLYING PROFIT BEFORE TAX PBT
Underlying PBT is a non-statutory measure used by the Qantas Group’s Executive Committee and the Board of Directors
as the primary measure to assess the Group’s financial performance.
Key Performance Indicators Unit 2012 2011 GRI Indicator
Underlying PBT $M EC
The Group’s Underlying PBT of $95 million was achieved in a challenging year of major transformational change. The Group’s
portfolio of businesses performed well except Qantas’ international network, where a four-pillar plan for turning around this
loss-making part of the business exists.
Statutory loss after tax was $244 million (2011: Statutory profit after tax of $249 million). Refer to Note 2(E) to the Financial Statements
on page 83 for a reconciliation of Underlying PBT to Statutory PBT.
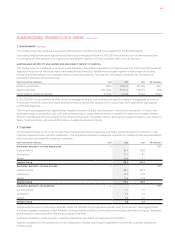
NET UNDERLYING UNIT COST
Minimising unit cost is a key management indicator of financial performance and the sustainability of the Qantas Group. It involves
constantly finding ways to minimise costs while maintaining the highest standards of safety and an optimal level of customer
experience. Unit cost performance forms part of the performance measures for incentive plans pursuant to the Group’s Executive
remuneration framework.
Key Performance Indicators Unit 2012 2011 GRI Indicator
Net Underlying Unit Cost Cents per ASK . . EC
Net Underlying Unit Cost decreased by 0.02 cents per ASK from 2010/2011. Refer to the Review of Operations on page 18 of the Annual Report.
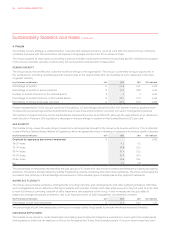
4. People continued
147