Qantas 2012 Annual Report Download - page 46
Download and view the complete annual report
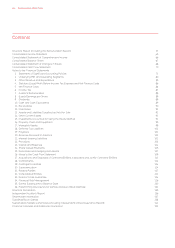
Please find page 46 of the 2012 Qantas annual report below. You can navigate through the pages in the report by either clicking on the pages listed below, or by using the keyword search tool below to find specific information within the annual report.-
 1
1 -
2
-
3
-
4
-
5
-
6
-
7
-
8
-
9
-
10
-
11
-
12
-
13
-
14
-
15
-
16
-
17
-
18
-
19
-
20
-
21
-
22
-
23
-
24
-
25
-
26
-
27
-
28
-
29
-
30
-
31
-
32
-
33
-
34
-
35
-
 36
36 -
 37
37 -
 38
38 -
 39
39 -
 40
40 -
 41
41 -
 42
42 -
 43
43 -
 44
44 -
 45
45 -
 46
46 -
 47
47 -
 48
48 -
 49
49 -
 50
50 -
 51
51 -
 52
52 -
 53
53 -
 54
54 -
 55
55 -
 56
56 -
57
-
58
-
59
-
60
-
61
-
62
-
63
-
64
-
65
-
66
-
67
-
68
-
69
-
70
-
71
-
72
-
73
-
74
-
75
-
76
-
77
-
78
-
79
-
80
-
81
-
82
-
83
-
84
-
85
-
86
-
87
-
88
-
89
-
90
-
91
-
92
-
93
-
94
-
95
-
96
-
97
-
98
-
99
-
100
-
101
-
102
-
103
-
104
-
105
-
106
-
107
-
108
-
109
-
110
-
111
-
112
-
113
-
114
-
115
-
116
-
117
-
118
-
119
-
120
-
121
-
122
-
123
-
124
-
125
-
126
-
127
-
128
-
129
-
130
-
131
-
132
-
133
-
134
-
135
-
136
-
137
-
138
-
139
-
140
-
141
-
142
-
143
-
144
-
145
-
146
-
147
-
148
-
149
-
150
-
151
-
152
-
153
-
154
-
155
-
156
 |
 |

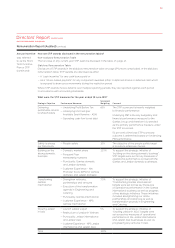
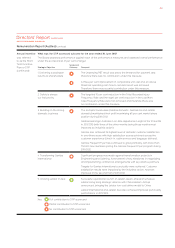
FOR THE YEAR ENDED 30 JUNE 2012
Directors’ Report continued
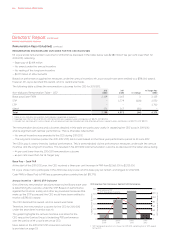
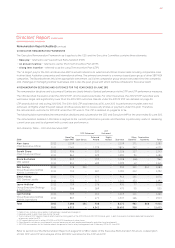
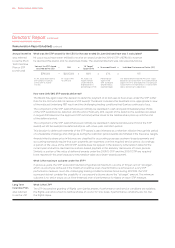
REMUNERATION DECISIONS AND OUTCOMES FOR THE CEO IN 2011/2012
Mr Joyce’s total remuneration outcome for 2011/2012 as disclosed in the table below was $2.280 million1 (44 per cent lower than for
2010/2011), reflecting:
— Base pay of $2.109 million
— No award under the annual incentive
— No vesting of the long term incentive
— $0.171 million of other benefits
Based on performance against the measures under the annual incentive, Mr Joyce would have been entitled to a $792,000 award,
however, Mr Joyce declined this award, and no award was made.
The following table outlines the remuneration outcomes for the CEO for 2011/2012.
Non-statutory Remuneration Table - CEO
1
2012
$’000
2011
$’000 % Change
At Target Pay
$’000
Base pay (Cash FAR)2, , ,
STIP – , () ,
LTIP – – – ,
Other3 () –
Total , , () ,
1 Detail of non-statutory remuneration methodology is explained on page 60.
2 Reported Cash FAR is FAR of $2,125,000 (2011: $2,060,000) less superannuation contributions of $15,775 (2011: $15,199).
3 Includes non-cash benefits (such as travel), annual leave accruals, post employment and other benefits plus superannuation contributions of $15,775 (2011: $15,199).
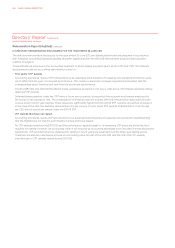
The remuneration decisions and outcomes detailed in this table are particularly useful in assessing the CEO’s pay in 2011/2012
and its alignment with Qantas’ performance. That is, this table reflects that:
— No annual incentive was awarded to the CEO during 2011/2012
— The long term incentive (under the 2010-2012 LTIP) did not vest based on the three year performance period to 30 June 2012
The CEO’s pay is clearly linked to Qantas’ performance. This is demonstrated via the performance measures under both the annual
incentive and the long term incentive. This resulted in his 2011/2012 total remuneration outcome as disclosed in the table1 above being:
— 44 per cent lower than his 2010/2011 remuneration outcome
— 64 per cent lower than his ‘At Target’ pay
Base Pay – Cash FAR
At the start of the 2011/2012 year, the CEO received a three per cent increase in FAR from $2,060,000 to $2,125,000.
Mr Joyce chose not to participate in the 2012 base pay review and his base pay will remain unchanged for 2012/2013.
Cash FAR (or Base Pay) is FAR less superannuation contributions (of $15,775).
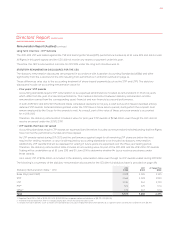
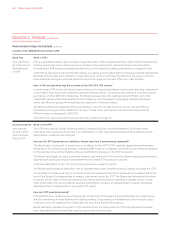
Annual Incentive - 2011/12 STIP Outcome
One of the key remuneration decisions made by the Board each year
is determining the outcome under the STIP. Based on performance
against the financial, safety and other key business measures that
make up the STIP scorecard, the CEO would have been entitled to
receive a $792,000 award.
The CEO declined this award, and no award was made.
Therefore, the remuneration outcome for the CEO for 2011/2012
under the short term incentive was nil.
The graph highlights the annual incentive outcomes for the
CEO versus the Qantas Group’s Underlying PBT performance
over the period of Mr Joyce’s tenure as CEO.
More detail on the 2011/2012 STIP scorecard outcomes
is provided on page 53.
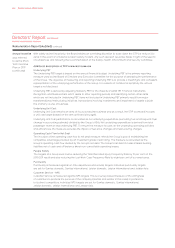
Remuneration Report (Audited) continued
2008/
2009 2009/
2010 2010/
2011 2011/
20121
0
100
200
300
400
500
600
Underlying PBT ($ million)
STIP Scorecard Outcome (%)
CEO Incentive Plan Outcome vs Qantas Profit Performance
Underlying PBT
STIP Scorecard Outcome
0
20
40
60
80
100
120
140
1 STIP Scorecard result of nil is shown for 2011/2012, reflecting the nil STIP award
to the CEO.
QANTAS ANNUAL REPORT 2012044