Qantas 2012 Annual Report Download - page 147
Download and view the complete annual report
Please find page 147 of the 2012 Qantas annual report below. You can navigate through the pages in the report by either clicking on the pages listed below, or by using the keyword search tool below to find specific information within the annual report.-
 1
1 -
2
-
3
-
4
-
5
-
6
-
7
-
8
-
9
-
10
-
11
-
12
-
13
-
14
-
15
-
16
-
17
-
18
-
19
-
20
-
21
-
22
-
23
-
24
-
25
-
26
-
27
-
28
-
29
-
30
-
31
-
32
-
33
-
34
-
35
-
36
-
37
-
38
-
39
-
40
-
41
-
42
-
43
-
44
-
45
-
46
-
47
-
48
-
49
-
50
-
51
-
52
-
53
-
54
-
55
-
56
-
57
-
58
-
59
-
60
-
61
-
62
-
63
-
64
-
65
-
66
-
67
-
68
-
69
-
70
-
71
-
72
-
73
-
74
-
75
-
76
-
77
-
78
-
79
-
80
-
81
-
82
-
83
-
84
-
85
-
86
-
87
-
88
-
89
-
90
-
91
-
92
-
93
-
94
-
95
-
96
-
97
-
98
-
99
-
100
-
101
-
102
-
103
-
104
-
105
-
106
-
107
-
108
-
109
-
110
-
111
-
112
-
113
-
114
-
115
-
116
-
117
-
118
-
119
-
120
-
121
-
122
-
123
-
124
-
125
-
126
-
127
-
128
-
129
-
130
-
131
-
132
-
133
-
134
-
135
-
136
-
 137
137 -
 138
138 -
 139
139 -
 140
140 -
 141
141 -
 142
142 -
 143
143 -
 144
144 -
 145
145 -
 146
146 -
 147
147 -
 148
148 -
 149
149 -
 150
150 -
 151
151 -
 152
152 -
 153
153 -
 154
154 -
 155
155 -
 156
156
 |
 |

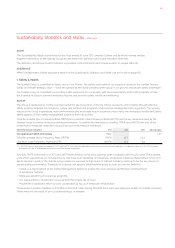
Sustainability Statistics and Notes continued
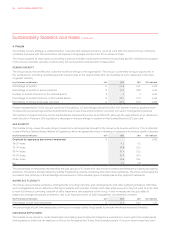
The Qantas Group has achieved 3.4 per cent improvement in aviation fuel efficiency against the 2008/2009 baseline.
Fuel saving targets have been agreed across the Group’s flying businesses for 2012/2013 and activities such as international fleet
re-configuration, fleet renewal and ongoing fuel optimisation activities will have a positive effect on fuel efficiency.
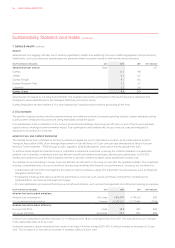
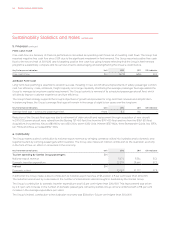
AUSTRALIAN ELECTRICITY USE, WATER USE AND DIRECT WASTE TO LANDFILL
The Qantas Group is committed to being an environmentally responsible organisation across all levels and functions of the business.
Targets for reduction of electricity, water and waste diverted directly to landfill have brought together a wide range of activities
across all business areas, from corporate offices to ground operations. Tracking this consumption facilitates the monitoring of
operational efficiency and cost savings.
Key Performance Indicators Unit 2012 2011 GRI Indicator
Electricity (Australia) MWh , , EN
Water (Australia) ’ Litres , , EN
Direct waste to landfill (Australia) Tonnes , , EN
In 2011/2012 the Group refreshed its utility reduction strategy moving to new business unit specific targets that aggregate at a Group
level to give electricity, water and waste diverted directly to landfill 2020 targets of 10, 10 and 20 per cent respectively (set against
a 2009/2010 baseline).
The Group has progressed well against these targets achieving a 2.9 per cent decrease in electricity consumption, a 2.5 per cent
decrease in water consumption and a 13.5 per cent decrease in waste diverted directly to landfill. The reduction in waste diverted
directly to landfill was primarily a result of the initiative introduced in November 2010 to divert general waste in Sydney to an Advance
Waste Treatment facility with around 350 tonnes of waste diverted each month.
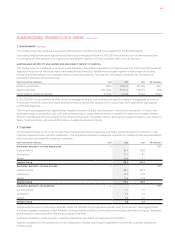
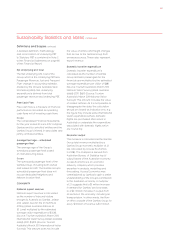
3. Customer
On-time performance is one of the Group’s most important operational measures and has a significant impact on efficiency, cost,
customer experience and customer satisfaction. This operational measure is especially important for Qantas Airlines and QantasLink,
whose services are targeted at premium customers.
Key Performance Indicators Unit 2012 2011 GRI Indicator
Australian domestic on-time departures % PR
Qantas Airlines . .
QantasLink . .
Jetstar . .
Qantas Group . .
Australian domestic on-time arrivals % PR
Qantas Airlines . .
QantasLink . .
Jetstar . .
Qantas Group . .
Australian domestic cancellations % PR
Qantas Airlines . .
QantasLink . .
Jetstar . .
Qantas Group . .
Qantas was the most on-time major domestic airline for 2011/2012 for jet operations greater than 10,000 sectors, and outperformed
our major domestic competitor, Virgin Australia. This was despite Qantas’ on-time performance being impacted in August, September
and October by industrial action and the grounding of the fleet.
Australian domestic on-time arrivals for Qantas, QantasLink and Jetstar all improved from 2010/2011.
Qantas’ consistent on-time performance has contributed to Qantas reaching the highest level of domestic customer satisfaction
in three years.
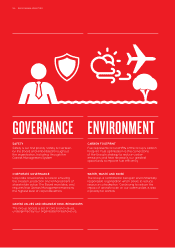
2. Environment continued
145