Qantas 2012 Annual Report Download - page 26
Download and view the complete annual report
Please find page 26 of the 2012 Qantas annual report below. You can navigate through the pages in the report by either clicking on the pages listed below, or by using the keyword search tool below to find specific information within the annual report.-
 1
1 -
2
-
3
-
4
-
5
-
6
-
7
-
8
-
9
-
10
-
11
-
12
-
13
-
14
-
15
-
 16
16 -
 17
17 -
 18
18 -
 19
19 -
 20
20 -
 21
21 -
 22
22 -
 23
23 -
 24
24 -
 25
25 -
 26
26 -
 27
27 -
 28
28 -
 29
29 -
 30
30 -
 31
31 -
 32
32 -
 33
33 -
 34
34 -
 35
35 -
 36
36 -
37
-
38
-
39
-
40
-
41
-
42
-
43
-
44
-
45
-
46
-
47
-
48
-
49
-
50
-
51
-
52
-
53
-
54
-
55
-
56
-
57
-
58
-
59
-
60
-
61
-
62
-
63
-
64
-
65
-
66
-
67
-
68
-
69
-
70
-
71
-
72
-
73
-
74
-
75
-
76
-
77
-
78
-
79
-
80
-
81
-
82
-
83
-
84
-
85
-
86
-
87
-
88
-
89
-
90
-
91
-
92
-
93
-
94
-
95
-
96
-
97
-
98
-
99
-
100
-
101
-
102
-
103
-
104
-
105
-
106
-
107
-
108
-
109
-
110
-
111
-
112
-
113
-
114
-
115
-
116
-
117
-
118
-
119
-
120
-
121
-
122
-
123
-
124
-
125
-
126
-
127
-
128
-
129
-
130
-
131
-
132
-
133
-
134
-
135
-
136
-
137
-
138
-
139
-
140
-
141
-
142
-
143
-
144
-
145
-
146
-
147
-
148
-
149
-
150
-
151
-
152
-
153
-
154
-
155
-
156
 |
 |

FOR THE YEAR ENDED 30 JUNE 2012
Review of Operations continued
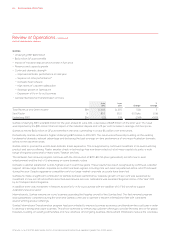
June
2012
June
2011 Change
%
Change
Members M . . .
Billings $M , ,
Underlying EBIT $M () ()
Normalisation Adjustment $M – () ()
Normalised EBIT26 $M
Qantas Frequent Flyer’s Normalised EBIT was $231 million for the year ended 30 June 2012. The result was a 14 per cent improvement
compared to prior year Normalised EBIT. Membership has grown 9 per cent to 8.6 million, averaging more than 2,000 new members each day.
Qantas Frequent Flyer has developed into the premier loyalty business in Australia. The acquisition of Wishlist Holdings Ltd with
over 100 loyalty programs has broadened the business into the employee reward and recognition market.
Program enhancements and alliances combined with continued growth in membership have allowed the business to generate billings
growth of 14 per cent. Customer satisfaction measured through the Qantas Frequent Flyer Net Promoter Score is higher than levels
recorded before the industrial dispute.
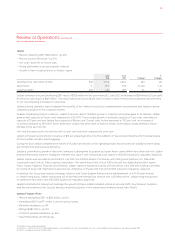
The Qantas Frequent Flyer program was further enhanced during the year through:
— Improved tier and cabin benefits
— The launch of “Platinum One” a level of recognition for the most valuable frequent flyers
— Improved access to classic award seats and upgrades
— Expanded Jetstar earn and redeem options
— A new look Qantas Frequent Flyer Store with over three thousand products, experiences and vouchers
— A simplified reward option where members can register to receive quarterly retail vouchers delivered to their home
Significant partner expansion was also achieved through the launch of Optus and new credit card partners Bankwest, Jetstar
Mastercard and Qantas Staff Credit Union. The continued expansion of business to business partnerships includes the launch
of GunzDental and Isuzu Trucks. Qantas Frequent Flyer has over 500 partners through which members can now earn points.
Qantas Freight
— Underlying EBIT $45 million, down $17 million
— Continued growth in Asia
— Weakness in worldwide airfreight markets
June
2012
June
2011 Change
%
Change
Total Revenue and Other Income $M , , () ()
Underlying EBIT $M () ()
Load Factor % . . (.) pts ()
Qantas Freight’s Underlying EBIT was $45 million for the year ended 30 June 2012, a decrease of $17 million on the prior year.
The downturn in global airfreight markets resulted in a 9 per cent reduction in load. Significant increases in fuel price and
an unfavourable foreign exchange impact was partially offset by a 2 per cent improvement in yield.
Capacity in the Asian market is growing through Jetstar’s international and the Jetstar branded franchises in Asia. Freighter
operations to Chongqing commenced in April 2012.
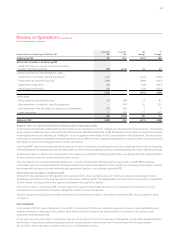
Reconciliation of Underlying PBT to Statutory PBT
Statutory PBT has declined to a loss of $349 million for the year ended 30 June 2012 from a profit of $323 million in the prior year.
Underlying PBT
Underlying PBT is a non-statutory measure, and is the primary reporting measure used by the Qantas Group’s chief operating
decision-making bodies, being the Executive Committee and the Board of Directors. The objective of measuring and reporting
Underlying PBT is to provide a meaningful and consistent representation of the underlying performance of the Group.
Underlying PBT is derived by adjusting Statutory PBT for the impacts of AASB 139: Financial Instruments: Recognition and Measurement
(AASB 139) which relate to other reporting periods and identifying certain other items which are not included in Underlying PBT.
Qantas Frequent Flyer continued
26 Normalised EBIT is a non-statutory measure which creates a comparable basis for the presentation of results. It adjusts Qantas Frequent Flyer Underlying EBIT for the effect
of change in accounting estimates of the fair value of points and breakage expectations effective 1 January 2009. The effect of this difference was that revenue for the year
ending 30 June 2011 was $140 million higher than it would have been had the deferred value per point been the same as that applied in the current period.
QANTAS ANNUAL REPORT 2012024