Qantas 2012 Annual Report Download - page 22
Download and view the complete annual report
Please find page 22 of the 2012 Qantas annual report below. You can navigate through the pages in the report by either clicking on the pages listed below, or by using the keyword search tool below to find specific information within the annual report.-
 1
1 -
2
-
3
-
4
-
5
-
6
-
7
-
8
-
9
-
10
-
11
-
 12
12 -
 13
13 -
 14
14 -
 15
15 -
 16
16 -
 17
17 -
 18
18 -
 19
19 -
 20
20 -
 21
21 -
 22
22 -
 23
23 -
 24
24 -
 25
25 -
 26
26 -
 27
27 -
 28
28 -
 29
29 -
 30
30 -
 31
31 -
 32
32 -
33
-
34
-
35
-
36
-
37
-
38
-
39
-
40
-
41
-
42
-
43
-
44
-
45
-
46
-
47
-
48
-
49
-
50
-
51
-
52
-
53
-
54
-
55
-
56
-
57
-
58
-
59
-
60
-
61
-
62
-
63
-
64
-
65
-
66
-
67
-
68
-
69
-
70
-
71
-
72
-
73
-
74
-
75
-
76
-
77
-
78
-
79
-
80
-
81
-
82
-
83
-
84
-
85
-
86
-
87
-
88
-
89
-
90
-
91
-
92
-
93
-
94
-
95
-
96
-
97
-
98
-
99
-
100
-
101
-
102
-
103
-
104
-
105
-
106
-
107
-
108
-
109
-
110
-
111
-
112
-
113
-
114
-
115
-
116
-
117
-
118
-
119
-
120
-
121
-
122
-
123
-
124
-
125
-
126
-
127
-
128
-
129
-
130
-
131
-
132
-
133
-
134
-
135
-
136
-
137
-
138
-
139
-
140
-
141
-
142
-
143
-
144
-
145
-
146
-
147
-
148
-
149
-
150
-
151
-
152
-
153
-
154
-
155
-
156
 |
 |

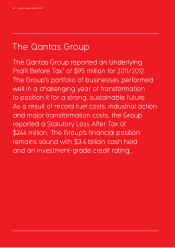
FOR THE YEAR ENDED 30 JUNE 2012
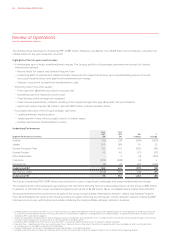
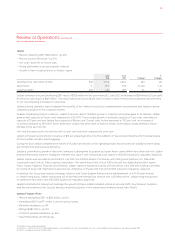
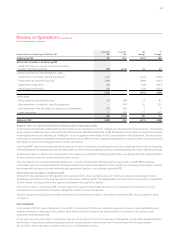
Review of Operations continued
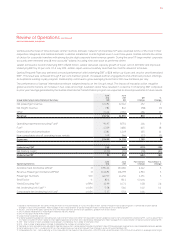
Overall, the Group continued to deliver improvements in yield and unit cost compared to prior year.
Average Group yield excluding foreign exchange (FX) improved 3 per cent. This was driven by yield improvement of 4 per cent on the Group
domestic network and 2 per cent on the Group international network. Comparable Unit Cost reduced 3 per cent compared to prior year.
Improving Cash Flow and Liquidity
Cash Flow Summary
First Half
2011/2012
$M
Second Half
2011/2012
$M
June
2012
$M
June
2011
$M
$M
Change
%
Change
Cash at beginning of period , , , , () ()
Operating cash flows , ,
Investing cash flows (,) () (,) (,)
Free cash flow18 () () ()
Financing cash flows () () ()
Effect of foreign exchange on cash () () >
Cash at period end , , , , () ()
Operating cash flows grew to $1,810 million for the year ended 30 June 2012, an increase of 2 per cent on the prior year result of $1,782 million.
The Group achieved free cash flow of $206 million for the second half of 2011/2012.
Investing cash flows decreased to $2,282 million for the year ended 30 June 2012, a reduction of 8 per cent on the prior year of $2,478
million. This result reflects the disciplined management of capital expenditure through the year in light of a weaker general economic
outlook. Given the Group’s fleet renewal program is substantially complete, focus has turned to deleveraging and strengthening the
Group’s credit metrics.
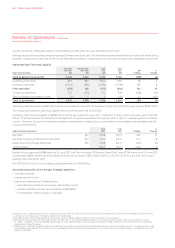
Debt and Gearing Analysis
June
2012
June
2011
Change
%
Change
Net Debt19 $M , ,
Net Debt Including Off Balance Sheet Debt20 $M , ,
Equity (Excluding Hedge Reserves) $M , , () ()
Gearing Ratio21 : : pts
Qantas Group cash was $3,398 million at 30 June 2012. Net Debt including Off Balance Sheet Debt19 was $7,544 million as at 30 June 2012,
a decrease of $243 million from 31 December 2011 and an increase of $574 million from 30 June 2011. As at 30 June 2012, the Group’s
gearing ratio was 56 per cent.
For 2012/2013, the Group is forecasting capital expenditure of $1.9 billion.
Successful execution of the Group’s strategic objectives
— Domestic strength
— Jetstar growth in Asia
— Significant International Transformation
— Strengthening alliances and exiting loss-making routes
— Qantas international fleet reconfiguration (A380/B747)
— Fundamental reform of legacy cost base
18 Free cash flow – Operating cash flows less investing cash flows. Free cash flow is a measure of the amount of operating cash flows that are available (i.e. after investing
activities) to fund reductions in net debt or payments to shareholders.
19 Net Debt includes interest-bearing liabilities and the fair value of hedges related to debt less cash and aircraft security deposits.
20 Net Debt Including Off Balance Sheet Debt includes Net Debt and non-cancellable operating leases. This measure reflects the total debt funding used by the Group
to support its operations. Non-cancellable operating leases are a representation assuming assets are owned and debt funded and is not consistent with the disclosure
requirements of AASB117: Leases.
21 Gearing Ratio is Net Debt including Off Balance Sheet Debt to Net Debt including Off Balance Sheet Debt and Equity (excluding hedge reserves). The gearing ratio is used
by Management to represent the Qantas Group’s entire capital position by measuring the proportion of the Group’s total net funding provided using debt both on and off
balance sheet debt.
QANTAS ANNUAL REPORT 2012020