Qantas 2006 Annual Report Download - page 95
Download and view the complete annual report
Please find page 95 of the 2006 Qantas annual report below. You can navigate through the pages in the report by either clicking on the pages listed below, or by using the keyword search tool below to find specific information within the annual report.-
 1
1 -
2
-
3
-
4
-
5
-
6
-
7
-
8
-
9
-
10
-
11
-
12
-
13
-
14
-
15
-
16
-
17
-
18
-
19
-
20
-
21
-
22
-
23
-
24
-
25
-
26
-
27
-
28
-
29
-
30
-
31
-
32
-
33
-
34
-
35
-
36
-
37
-
38
-
39
-
40
-
41
-
42
-
43
-
44
-
45
-
46
-
47
-
48
-
49
-
50
-
51
-
52
-
53
-
54
-
55
-
56
-
57
-
58
-
59
-
60
-
61
-
62
-
63
-
64
-
65
-
66
-
67
-
68
-
69
-
70
-
71
-
72
-
73
-
74
-
75
-
76
-
77
-
78
-
79
-
80
-
81
-
82
-
83
-
84
-
 85
85 -
 86
86 -
 87
87 -
 88
88 -
 89
89 -
 90
90 -
 91
91 -
 92
92 -
 93
93 -
 94
94 -
 95
95 -
 96
96 -
 97
97 -
 98
98 -
 99
99 -
 100
100 -
 101
101 -
 102
102 -
 103
103 -
 104
104 -
 105
105 -
106
-
107
-
108
-
109
-
110
-
111
-
112
-
113
-
114
-
115
-
116
-
117
-
118
-
119
-
120
-
121
-
122
-
123
-
124
-
125
-
126
-
127
-
128
-
129
-
130
-
131
-
132
-
133
-
134
-
135
-
136
-
137
-
138
-
139
-
140
-
141
-
142
-
143
-
144
-
145
-
146
-
147
-
148
 |
 |

93
Qantas Annual Report 2006
Notes to the Financial Statements
for the year ended 30 June 2006
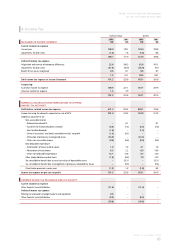
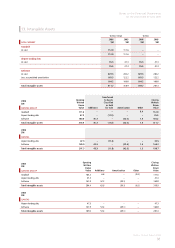
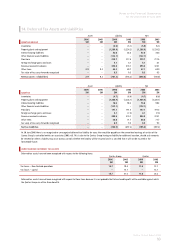
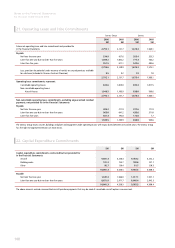
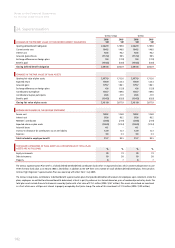
14. Deferred Tax Assets and Liabilities
Asset Liability Net
2006
$M
2005
$M
2006
$M
2005
$M
2006
$M
2005
$M
QANTAS GROUP
Inventories ––(5.0) (5.1) (5.0) (5.1)
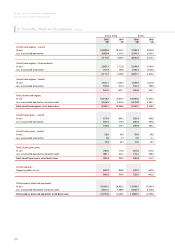
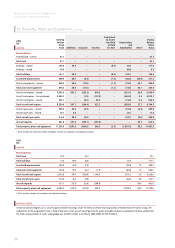
Property, plant and equipment ––(1,286.9) (1,224.2) (1,286.9) (1,224.2)
Interest-bearing liabilities ––32.0 36.4 32.0 36.4
Other financial assets/liabilities ––(122.1) –(122.1) –
Provisions ––229.7 217.5 229.7 217.5
Foreign exchange gains and losses ––5.1 4.1 5.1 4.1
Revenue received in advance ––393.3 374.1 393.3 374.1
Other items 2.9 0.2 44.2 69.7 47.1 69.9
Tax value of loss carry-forwards recognised ––8.5 9.3 8.5 9.3
Net tax assets / (liabilities) 2.9 0.2 (701.2) (518.2) (698.3) (518.0)
Asset Liability Net
2006
$M
2005
$M
2006
$M
2005
$M
2006
$M
2005
$M
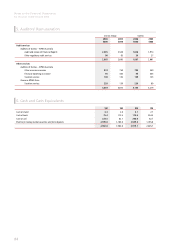
QANTAS
Inventories ––(4.7) (6.6) (4.7) (6.6)
Property, plant and equipment ––(1,306.9) (1,228.1) (1,306.9) (1,228.1)
Interest-bearing liabilities ––76.6 98.2 76.6 98.2
Other financial assets/liabilities ––(122.1) –(122.1) –
Provisions ––197.1 191.5 197.1 191.5
Foreign exchange gains and losses ––4.1 (7.3) 4.1 (7.3)
Revenue received in advance ––393.3 374.1 393.3 374.1
Other items ––48.6 71.7 48.6 71.7
Tax value of loss carry-forwards recognised ––8.5 9.3 8.5 9.3
Net tax liabilities – –(705.5) (497.2) (705.5) (497.2)
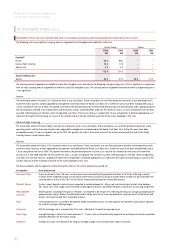
At 30 June 2006 there is no recognised or unrecognised deferred tax liability for taxes that would be payable on the unremitted earnings of certain of the
Qantas Group’s controlled entities or associates (2005: nil). This is due to the Qantas Group having no liability for additional taxation, should such amounts
be remitted or where a liability may arise, Qantas controls whether the liability will be incurred and it is satisfied that it will not be incurred in the
foreseeable future.
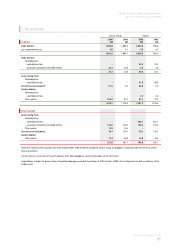
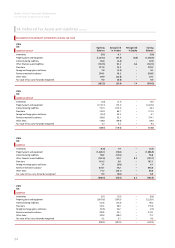
UNRECOGNISED DEFERRED TAX ASSETS
Deferred tax assets have not been recognised with respect to the following items:
Qantas Group Qantas
2006
$M
2005
$M
2006
$M
2005
$M
Tax losses – New Zealand operations 13.7 18.4 11.6 12.1
Tax losses – capital –13.1 –13.1
13.7 31.5 11.6 25.2
Deferred tax assets have not been recognised with respect to these items because it is not probable that future taxable profit will be available against which
the Qantas Group can utilise these benefits.