Qantas 2006 Annual Report Download - page 134
Download and view the complete annual report
Please find page 134 of the 2006 Qantas annual report below. You can navigate through the pages in the report by either clicking on the pages listed below, or by using the keyword search tool below to find specific information within the annual report.-
 1
1 -
2
-
3
-
4
-
5
-
6
-
7
-
8
-
9
-
10
-
11
-
12
-
13
-
14
-
15
-
16
-
17
-
18
-
19
-
20
-
21
-
22
-
23
-
24
-
25
-
26
-
27
-
28
-
29
-
30
-
31
-
32
-
33
-
34
-
35
-
36
-
37
-
38
-
39
-
40
-
41
-
42
-
43
-
44
-
45
-
46
-
47
-
48
-
49
-
50
-
51
-
52
-
53
-
54
-
55
-
56
-
57
-
58
-
59
-
60
-
61
-
62
-
63
-
64
-
65
-
66
-
67
-
68
-
69
-
70
-
71
-
72
-
73
-
74
-
75
-
76
-
77
-
78
-
79
-
80
-
81
-
82
-
83
-
84
-
85
-
86
-
87
-
88
-
89
-
90
-
91
-
92
-
93
-
94
-
95
-
96
-
97
-
98
-
99
-
100
-
101
-
102
-
103
-
104
-
105
-
106
-
107
-
108
-
109
-
110
-
111
-
112
-
113
-
114
-
115
-
116
-
117
-
118
-
119
-
120
-
121
-
122
-
123
-
 124
124 -
 125
125 -
 126
126 -
 127
127 -
 128
128 -
 129
129 -
 130
130 -
 131
131 -
 132
132 -
 133
133 -
 134
134 -
 135
135 -
 136
136 -
 137
137 -
 138
138 -
 139
139 -
 140
140 -
 141
141 -
 142
142 -
 143
143 -
 144
144 -
145
-
146
-
147
-
148
 |
 |

132
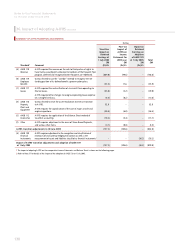
Notes to the Financial Statements
for the year ended 30 June 2006
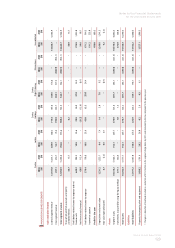
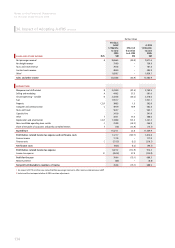
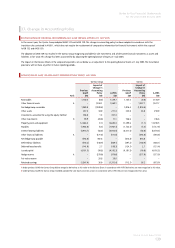
36. Impact of Adopting A-IFRS continued
Qantas Group
Refs
Previous
GAAP
1 July
2004
$M
Effect of
Transition
to A-IFRS
$M
A-IFRS
1 July
2004
$M
Previous
GAAP
30 June
2005
$M
Effect of
Transition
to A-IFRS
$M
A-IFRS
30 June
2005
$M
Effect of
Adoption
of AASB
132 and 139
$M
A-IFRS
1 July
2005
$M
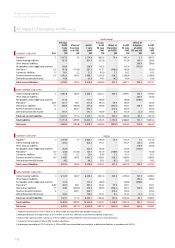
CURRENT LIABILITIES
Payables1,2 C 2,167.5 7.3 2,174.8 1,882.6 19.4 1,902.0 5.3 1,907.3
Interest-bearing liabilities 821.9 – 821.9 315.0 – 315.0 (45.1) 269.9
Other financial liabilities – – – – – – 288.0 288.0
Net payables under hedge/swap contracts 250.8 – 250.8 142.8 – 142.8 (142.8) –
Provisions1,3 A,F 381.6 (174.3) 207.3 577.7 (148.9) 428.8 – 428.8
Current tax liabilities E4 30.1 2.2 32.3 85.9 7.3 93.2 – 93.2
Revenue received in advance A,F 1,493.3 493.2 1,986.5 1,535.8 570.2 2,106.0 – 2,106.0
Deferred lease benefits/income 45.0 – 45.0 44.1 (0.2) 43.9 – 43.9
Total current liabilities 5,190.2 328.4 5,518.6 4,583.9 447.8 5,031.7 105.4 5,137.1
NON-CURRENT LIABILITIES
Interest-bearing liabilities C 5,081.8 403.9 5,485.7 5,234.7 365.0 5,599.7 103.9 5,703.6
Other financial liabilities – – – – – – 283.6 283.6
Net payables under hedge/swap contracts 131.6 – 131.6 450.0 – 450.0 (450.0) –
Provisions2,3 A,B,F 331.7 80.1 411.8 387.4 55.9 443.3 – 443.3
Deferred tax liabilities E4 806.9 (349.3) 457.6 910.6 (392.4) 518.2 150.9 669.1
Revenue received in advance A – 636.7 636.7 – 676.6 676.6 – 676.6
Deferred lease benefits/income 191.7 – 191.7 140.9 0.1 141.0 (2.7) 138.3
Total non-current liabilities 6,543.7 771.4 7,315.1 7,123.6 705.2 7,828.8 85.7 7,914.5
Total liabilities 11,733.9 1,099.8 12,833.7 11,707.5 1,153.0 12,860.5 191.1 13,051.6
Net assets 5,840.3 (822.0) 5,018.3 6,426.9 (897.0) 5,529.9 325.0 5,854.9
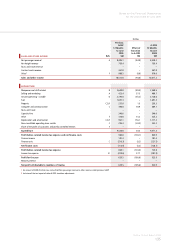
CURRENT LIABILITIES Qantas
Payables1,2 C 2,078.9 7.3 2,086.2 1,702.9 19.4 1,722.3 5.3 1,727.6
Interest-bearing liabilities 826.4 – 826.4 315.1 – 315.1 (45.1) 270.0
Other financial liabilities – – – – – – 310.0 310.0
Net payables under hedge/swap contracts 262.9 – 262.9 164.8 – 164.8 (164.8) –
Provisions1,3 A,F 328.8 (174.3) 154.5 521.9 (148.9) 373.0 – 373.0
Current tax liabilities E427.2 2.2 29.4 83.8 7.3 91.1 – 91.1
Revenue received in advance A,F 1,348.1 493.2 1,841.3 1,398.1 570.2 1,968.3 – 1,968.3
Deferred lease benefits/income 40.2 – 40.2 38.5 (0.2) 38.3 – 38.3
Total current liabilities 4,912.5 328.4 5,240.9 4,225.1 447.8 4,672.9 105.4 4,778.3
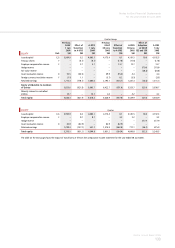
NON-CURRENT LIABILITIES
Interest-bearing liabilities C 6,134.3 403.9 6,538.2 5,831.4 365.0 6,196.4 103.9 6,300.3
Other financial liabilities – – – – – – 283.6 283.6
Net payables under hedge/swap contracts 131.6 – 131.6 450.0 – 450.0 (450.0) –
Provisions2,3 A,B,F 302.3 80.1 382.4 354.2 55.9 410.1 – 410.1
Deferred tax liabilities5E4788.3 (349.3) 439.0 893.9 (396.7) 497.2 150.9 648.1
Revenue received in advance A – 636.7 636.7 – 676.6 676.6 – 676.6
Deferred lease benefits/income 166.2 – 166.2 124.1 0.2 124.3 (2.7) 121.6
Total non-current liabilities 7,522.7 771.4 8,294.1 7,653.6 701.0 8,354.6 85.7 8,440.3
Total liabilities 12,435.2 1,099.8 13,535.0 11,878.7 1,148.8 13,027.5 191.1 13,218.6
Net assets 5,376.1 (831.2) 4,544.9 5,831.2 (934.4) 4,896.8 352.5 5,249.3
1 Frequent Flyer provision of $216.7 million as at 30 June 2005 was reclassified from payables to provisions.
2 Make good provision on property leases of $11.9 million as at 30 June 2005 was reclassified from payables to provisions.
3 Frequent Flyer provision of $39.2 million as at 30 June 2005 was reclassified from current provisions to non-current provisions.
4 Inclusive of the tax impact of other A-IFRS transition adjustments.
5 Intercompany receivables of $16.7 million as at 30 June 2005 were reclassified from receivables to deferred tax liabilities in accordance with UIG 52.