Qantas 2006 Annual Report Download - page 63
Download and view the complete annual report
Please find page 63 of the 2006 Qantas annual report below. You can navigate through the pages in the report by either clicking on the pages listed below, or by using the keyword search tool below to find specific information within the annual report.-
 1
1 -
2
-
3
-
4
-
5
-
6
-
7
-
8
-
9
-
10
-
11
-
12
-
13
-
14
-
15
-
16
-
17
-
18
-
19
-
20
-
21
-
22
-
23
-
24
-
25
-
26
-
27
-
28
-
29
-
30
-
31
-
32
-
33
-
34
-
35
-
36
-
37
-
38
-
39
-
40
-
41
-
42
-
43
-
44
-
45
-
46
-
47
-
48
-
49
-
50
-
51
-
52
-
 53
53 -
 54
54 -
 55
55 -
 56
56 -
 57
57 -
 58
58 -
 59
59 -
 60
60 -
 61
61 -
 62
62 -
 63
63 -
 64
64 -
 65
65 -
 66
66 -
 67
67 -
 68
68 -
 69
69 -
 70
70 -
 71
71 -
 72
72 -
 73
73 -
74
-
75
-
76
-
77
-
78
-
79
-
80
-
81
-
82
-
83
-
84
-
85
-
86
-
87
-
88
-
89
-
90
-
91
-
92
-
93
-
94
-
95
-
96
-
97
-
98
-
99
-
100
-
101
-
102
-
103
-
104
-
105
-
106
-
107
-
108
-
109
-
110
-
111
-
112
-
113
-
114
-
115
-
116
-
117
-
118
-
119
-
120
-
121
-
122
-
123
-
124
-
125
-
126
-
127
-
128
-
129
-
130
-
131
-
132
-
133
-
134
-
135
-
136
-
137
-
138
-
139
-
140
-
141
-
142
-
143
-
144
-
145
-
146
-
147
-
148
 |
 |
61
Qantas Annual Report 2006
Directors’ Report
for the year ended 30 June 2006
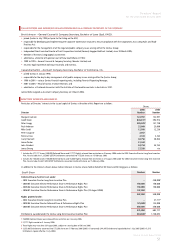
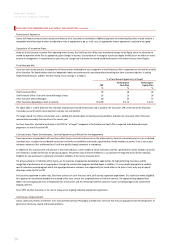
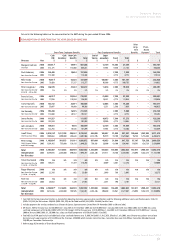
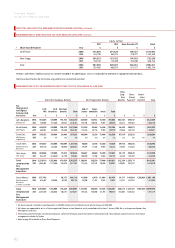
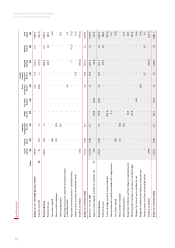
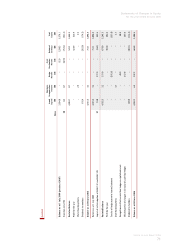
Set out in the following tables are the remuneration for the KMP during the year ended 30 June 2006:
REMUNERATION OF DIRECTORS FOR THE YEAR ENDED 30 JUNE 2006
Short-Term Employee Benefits Post Employment Benefits
Other
Long-
Term
Benefits
Share-
Based
Payment5Total
Directors Year
Cash
FAR
$
Cash
Incentives
$
Non-Cash
Benefi ts
$
Total
$
End of
Service
$
Super-
annuation
$
Travel
$
Total
$$ $ $
Margaret Jackson, 2006 447,6171– 59,591 507,208 – 12,139 15,400 27,539 – – 534,747
Chairman 2005 372,171 – 113,060 485,231 – 11,585 9,550 21,135 – – 506,366
Paul Anderson, 2006 146,400 – 10,634 157,034 – – 7,200 7,200 – – 164,234
Non-Executive Director 2005 114,348 – – 114,348 – – 4,775 4,775 – – 119,123
Mike Codd, 2006 94,6131– 42,426 137,039 – 100,587 7,200 107,787 – – 244,826
Non-Executive Director 2005 76,020 – 37,257 113,277 – 95,980 4,775 100,755 – – 214,032
Peter Cosgrove,22006 146,970 – 37,243 184,213 – 11,878 7,200 19,078 – – 203,291
Non-Executive Director
(6 Jul 05 – 30 Jun 06)
2005 n/a n/a n/a n/a n/a n/a n/a n/a n/a n/a n/a
Patricia Cross, 2006 64,7571– 153,544 218,301 – 25,000 7,200 32,200 – – 250,501
Non-Executive Director 2005 77,096 – 119,834 196,930 – 18,251 4,775 23,026 – – 219,956
Garry Hounsell, 2006 134,312 – 34,071 168,383 – 12,088 7,200 19,288 – – 187,671
Non-Executive Director 2005 53,097 – 46,089 99,186 – 5,251 2,388 7,639 – – 106,825
Jim Kennedy, 2006 195,200 – 16,325 211,525 – – 7,200 7,200 – – 218,725
Non-Executive Director 2005 172,000 – 20,517 192,517 – – 4,775 4,775 – – 197,292
James Packer, 2006 111,927 – – 111,927 – 10,073 7,200 17,273 – – 129,200
Non-Executive Director 2005 101,920 – – 101,920 – 10,080 4,775 14,855 – – 116,775
John Schubert, 2006 158,661 – 9,678 168,339 – 12,139 7,200 19,339 – – 187,678
Non-Executive Director 2005 122,763 – 18,536 141,299 – 11,585 4,775 16,360 – – 157,659
Geoff Dixon, 2006 2,018,5143 1,011,780 289,247 3,319,541 465,000 100,587 31,800 597,387 100,644 1,253,903 5,271,475
Chief Executive Officer 2005 1,905,863 1,490,000 205,643 3,601,506 1,414,785 95,979 19,100 1,529,864 95,753 1,255,550 6,482,673
Peter Gregg, 2006 1,185,8363501,875 211,161 1,898,872 867,000 48,953 31,800 947,753 87,167 726,538 3,660,330
Chief Financial Officer
and EGM Strategy
2005 1,164,415 755,000 129,118 2,048,533 788,501 28,800 19,100 836,401 119,341 626,724 3,630,999
Total 2006 4,704,807 1,513,655 863,920 7,082,382 1,332,000 333,444 136,600 1,802,044 187,811 1,980,441 11,052,678
remuneration
for Directors
2005 4,159,693 2,245,000 690,054 7,094,747 2,203,286 277,511 78,788 2,559,585 215,094 1,882,274 11,751,700
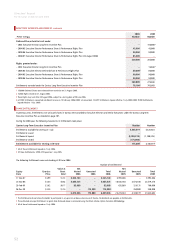
Trevor Eastwood, 2006 n/a n/a n/a n/a n/a n/a n/a n/a n/a n/a n/a
Non-Executive Director
(1 Jul 04 – 31 Mar 05)
2005 105,311 – 11,419 116,730 – 8,689 3,581 12,270 – – 129,000
Roger Maynard, 2006 n/a n/a n/a n/a n/a n/a n/a n/a n/a n/a n/a
Non-Executive Director
(1 Jul 04 – 8 Sep 04)
2005 22,768 – 662 23,430 – 2,049 796 2,845 – – 26,275
Nick Tait, 2006 n/a n/a n/a n/a n/a n/a n/a n/a n/a n/a n/a
Non-Executive Director
(1 Jul 04 – 8 Sep 04)
2005 26,564 – 1,370 27,934 – 2,391 796 3,187 – – 31,121
Total 2006 4,704,80741,513,655 863,920 7,082,382 1,332,000 333,444 136,600 1,802,044 187,811 1,980,441 11,052,678
remuneration
for Directors
2005 4,314,336 2,245,000 703,505 7,262,841 2,203,286 290,640 83,961 2,577,887 215,094 1,882,274 11,938,096
1 Cash FAR for the Non-Executive Directors is stated after deducting statutory superannuation contributions and the following additional salary sacrificed amounts: $28,244
(2005: $28,244) for Ms Jackson, $88,448 (2005: $84,395) for Mr Codd and $69,555 (2005: $55,666) for Mrs Cross.
2 Includes payments for services rendered as a Director of Qantas Superannuation Limited from 14 November 2005 to 30 June 2006.
3 Mr Dixon’s FAR for the year was $2,160,000 from 1 July 2005 to 31 December 2005 and $2,310,000 from 1 January 2006 to 30 June 2006 (2005: $2,115,000) less salary
sacrificed components of $216,486 (2005: $209,137). Mr Gregg’s FAR for the year was $1,310,000 from 1 July 2005 to 31 December 2005 and $1,375,000 from 1 January
2006 to 30 June 2006 (2005: $1,285,000) less salary sacrificed components of $156,664 (2005: $120,585).
4 Total NED Cash FAR paid inclusive of additional salary sacrifi ced elements was $1,686,704 (2005: $1,412,363). Effective 1 July 2005, each Director was paid an annual base
fee inclusive of superannuation of $122,000, and the Chairman $488,000 which includes Committee fees. Committee fees were $24,400 per Committee Membership and
$48,800 per Committee Chairmanship.
5 Refer to page 62 for details of Share-Based Payments.