Qantas 2006 Annual Report Download - page 136
Download and view the complete annual report
Please find page 136 of the 2006 Qantas annual report below. You can navigate through the pages in the report by either clicking on the pages listed below, or by using the keyword search tool below to find specific information within the annual report.-
 1
1 -
2
-
3
-
4
-
5
-
6
-
7
-
8
-
9
-
10
-
11
-
12
-
13
-
14
-
15
-
16
-
17
-
18
-
19
-
20
-
21
-
22
-
23
-
24
-
25
-
26
-
27
-
28
-
29
-
30
-
31
-
32
-
33
-
34
-
35
-
36
-
37
-
38
-
39
-
40
-
41
-
42
-
43
-
44
-
45
-
46
-
47
-
48
-
49
-
50
-
51
-
52
-
53
-
54
-
55
-
56
-
57
-
58
-
59
-
60
-
61
-
62
-
63
-
64
-
65
-
66
-
67
-
68
-
69
-
70
-
71
-
72
-
73
-
74
-
75
-
76
-
77
-
78
-
79
-
80
-
81
-
82
-
83
-
84
-
85
-
86
-
87
-
88
-
89
-
90
-
91
-
92
-
93
-
94
-
95
-
96
-
97
-
98
-
99
-
100
-
101
-
102
-
103
-
104
-
105
-
106
-
107
-
108
-
109
-
110
-
111
-
112
-
113
-
114
-
115
-
116
-
117
-
118
-
119
-
120
-
121
-
122
-
123
-
124
-
125
-
 126
126 -
 127
127 -
 128
128 -
 129
129 -
 130
130 -
 131
131 -
 132
132 -
 133
133 -
 134
134 -
 135
135 -
 136
136 -
 137
137 -
 138
138 -
 139
139 -
 140
140 -
 141
141 -
 142
142 -
 143
143 -
 144
144 -
 145
145 -
 146
146 -
147
-
148
 |
 |
134
Notes to the Financial Statements
for the year ended 30 June 2006
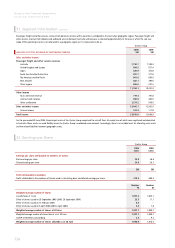
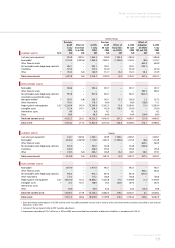
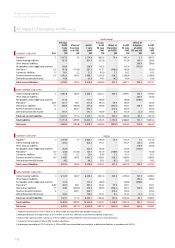
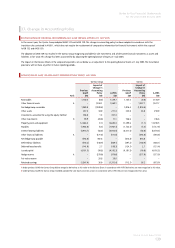
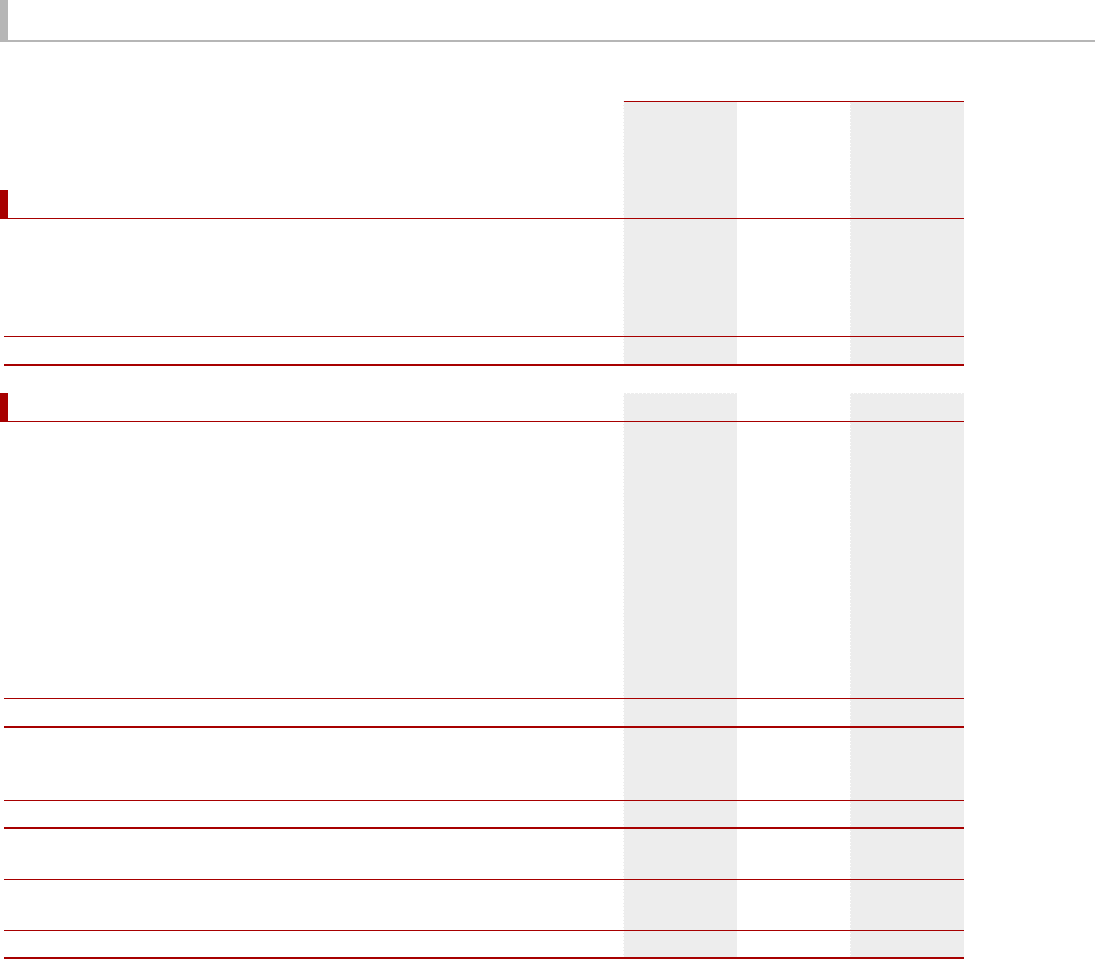
36. Impact of Adopting A-IFRS continued
Qantas Group
Refs
Previous
GAAP
12 Months
to June
2005
$M
Effect of
Transition
to A-IFRS
$M
A-IFRS
12 Months
to June
2005
$M
SALES AND OTHER INCOME
Net passenger revenue1A 9,656.5 (84.9) 9,571.6
Net freight revenue 759.9 – 759.9
Tours and travel revenue 707.8 – 707.8
Contract work revenue 484.9 – 484.9
Other1 1,039.7 – 1,039.7
Sales and other income 12,648.8 (84.9) 12,563.9
EXPENDITURE
Manpower and staff related B 3,244.9 (81.4) 3,163.5
Selling and marketing A 444.3 57.3 501.6
Aircraft operating – variable D 2,435.8 (65.2) 2,370.6
Fuel 1,931.7 – 1,931.7
Property C,D,F 300.5 1.5 302.0
Computer and communication C 491.9 10.9 502.8
Tours and travel 563.7 – 563.7
Capacity hire 341.0 – 341.0
Other F 365.1 15.5 380.6
Depreciation and amortisation C,D,F 1,100.0 141.3 1,241.3
Non-cancellable operating lease rentals C 310.0 (43.2) 266.8
Share of net profit of associates and jointly controlled entities F (1.8) (13.9) (15.7)
Expenditure 11,527.1 22.8 11,549.9
Profi t before related income tax expense and net fi nance costs 1,121.7 (107.7) 1,014.0
Finance income 117.0 – 117.0
Finance costs C (211.5) (5.2) (216.7)
Net fi nance costs (94.5) (5.2) (99.7)
Profi t before related income tax expense 1,027.2 (112.9) 914.3
Income tax expense E2(262.8) 37.8 (225.0)
Profi t for the year 764.4 (75.1) 689.3
Minority interest (0.8) – (0.8)
Net profi t attributable to members of Qantas 763.6 (75.1) 688.5
1 An amount of $178.6 million was reclassified from passenger revenue to other revenue under previous GAAP.
2 Inclusive of the tax impact of other A-IFRS transition adjustments.