Qantas 2006 Annual Report Download - page 116
Download and view the complete annual report
Please find page 116 of the 2006 Qantas annual report below. You can navigate through the pages in the report by either clicking on the pages listed below, or by using the keyword search tool below to find specific information within the annual report.-
 1
1 -
2
-
3
-
4
-
5
-
6
-
7
-
8
-
9
-
10
-
11
-
12
-
13
-
14
-
15
-
16
-
17
-
18
-
19
-
20
-
21
-
22
-
23
-
24
-
25
-
26
-
27
-
28
-
29
-
30
-
31
-
32
-
33
-
34
-
35
-
36
-
37
-
38
-
39
-
40
-
41
-
42
-
43
-
44
-
45
-
46
-
47
-
48
-
49
-
50
-
51
-
52
-
53
-
54
-
55
-
56
-
57
-
58
-
59
-
60
-
61
-
62
-
63
-
64
-
65
-
66
-
67
-
68
-
69
-
70
-
71
-
72
-
73
-
74
-
75
-
76
-
77
-
78
-
79
-
80
-
81
-
82
-
83
-
84
-
85
-
86
-
87
-
88
-
89
-
90
-
91
-
92
-
93
-
94
-
95
-
96
-
97
-
98
-
99
-
100
-
101
-
102
-
103
-
104
-
105
-
 106
106 -
 107
107 -
 108
108 -
 109
109 -
 110
110 -
 111
111 -
 112
112 -
 113
113 -
 114
114 -
 115
115 -
 116
116 -
 117
117 -
 118
118 -
 119
119 -
 120
120 -
 121
121 -
 122
122 -
 123
123 -
 124
124 -
 125
125 -
 126
126 -
127
-
128
-
129
-
130
-
131
-
132
-
133
-
134
-
135
-
136
-
137
-
138
-
139
-
140
-
141
-
142
-
143
-
144
-
145
-
146
-
147
-
148
 |
 |
114
Notes to the Financial Statements
for the year ended 30 June 2006
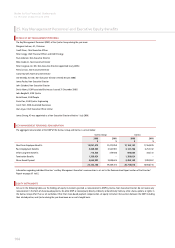
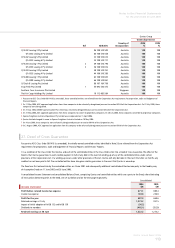
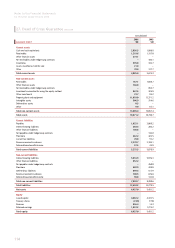
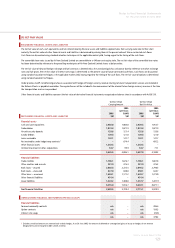
27. Deed of Cross Guarantee continued
Consolidated
2006
$M
2005
$M
BALANCE SHEET
Current assets
Cash and cash equivalents 2,856.5 1,860.8
Receivables 1,219.6 1,157.0
Other financial assets 474.1 –
Net receivables under hedge/swap contracts –185.1
Inventories 335.8 332.7
Assets classified as held for sale 21.0 –
Other 78.8 137.7
Total current assets 4,985.8 3,673.3
Non-current assets
Receivables 167.1 1,038.7
Other financial assets 766.8 –
Net receivables under hedge/swap contracts –853.7
Investments accounted for using the equity method 367.5 326.9
Other investments 73.7 85.2
Property, plant and equipment 11,993.0 12,371.2
Intangible assets 306.9 314.6
Deferred tax assets 0.5 –
Other 9.9 67.1
Total non-current assets 13,685.4 15,057.4
Total assets 18,671.2 18,730.7
Current liabilities
Payables 1,925.1 2,069.2
Interest-bearing liabilities 364.4 205.2
Other financial liabilities 136.8 –
Net payables under hedge/swap contracts –142.8
Provisions 462.2 422.5
Current tax liabilities 70.8 91.2
Revenue received in advance 2,278.7 2,104.1
Deferred lease benefits/income 37.5 43.9
Total current liabilities 5,275.5 5,078.9
Non-current liabilities
Interest-bearing liabilities 5,016.9 5,976.3
Other financial liabilities 352.2 –
Net payables under hedge/swap contracts –450.0
Provisions 482.9 438.8
Deferred tax liabilities 699.4 517.9
Revenue received in advance 708.5 676.6
Deferred lease benefits/income 98.8 141.0
Total non-current liabilities 7,358.7 8,200.6
Total liabilities 12,634.2 13,279.5
Net assets 6,037.0 5,451.2
Equity
Issued capital 4,382.2 4,181.5
Treasury shares (23.8) (17.8)
Reserves 356.4 14.3
Retained earnings 1,322.2 1,273.2
Total equity 6,037.0 5,451.2