Qantas 2006 Annual Report Download - page 47
Download and view the complete annual report
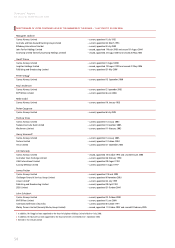
Please find page 47 of the 2006 Qantas annual report below. You can navigate through the pages in the report by either clicking on the pages listed below, or by using the keyword search tool below to find specific information within the annual report.-
 1
1 -
2
-
3
-
4
-
5
-
6
-
7
-
8
-
9
-
10
-
11
-
12
-
13
-
14
-
15
-
16
-
17
-
18
-
19
-
20
-
21
-
22
-
23
-
24
-
25
-
26
-
27
-
28
-
29
-
30
-
31
-
32
-
33
-
34
-
35
-
36
-
 37
37 -
 38
38 -
 39
39 -
 40
40 -
 41
41 -
 42
42 -
 43
43 -
 44
44 -
 45
45 -
 46
46 -
 47
47 -
 48
48 -
 49
49 -
 50
50 -
 51
51 -
 52
52 -
 53
53 -
 54
54 -
 55
55 -
 56
56 -
 57
57 -
58
-
59
-
60
-
61
-
62
-
63
-
64
-
65
-
66
-
67
-
68
-
69
-
70
-
71
-
72
-
73
-
74
-
75
-
76
-
77
-
78
-
79
-
80
-
81
-
82
-
83
-
84
-
85
-
86
-
87
-
88
-
89
-
90
-
91
-
92
-
93
-
94
-
95
-
96
-
97
-
98
-
99
-
100
-
101
-
102
-
103
-
104
-
105
-
106
-
107
-
108
-
109
-
110
-
111
-
112
-
113
-
114
-
115
-
116
-
117
-
118
-
119
-
120
-
121
-
122
-
123
-
124
-
125
-
126
-
127
-
128
-
129
-
130
-
131
-
132
-
133
-
134
-
135
-
136
-
137
-
138
-
139
-
140
-
141
-
142
-
143
-
144
-
145
-
146
-
147
-
148
 |
 |
45
Qantas Annual Report 2006
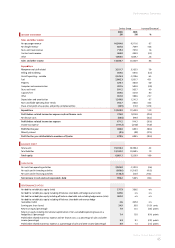
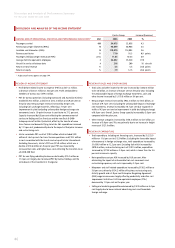
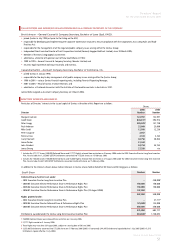
Performance Summary
Qantas Group Increase/(Decrease)
2006
$M
2005
$M %
INCOME STATEMENT
Sales and other income
Net passenger revenue 10,504.0 9,571.6 9.7
Net freight revenue 887.8 759.9 16.8
Tours and travel revenue 719.4 707.8 1.6
Contract work revenue 469.0 484.9 (3.3)
Other 1,066.5 1,039.7 2.6
Sales and other income 13,646.7 12,563.9 8.6
Expenditure
Manpower and staff related 3,321.7 3,163.5 5.0
Selling and marketing 469.6 501.6 (6.4)
Aircraft operating – variable 2,525.3 2,370.6 6.5
Fuel 2,802.3 1,931.7 45.1
Property 320.1 302.0 6.0
Computer and communication 487.5 502.8 (3.0)
Tours and travel 591.2 563.7 4.9
Capacity hire 369.6 341.0 8.4
Other 467.0 380.6 22.7
Depreciation and amortisation 1,249.8 1,241.3 0.7
Non-cancellable operating lease rentals 355.7 266.8 33.3
Share of net profit of associates and jointly controlled entities (38.9) (15.7) 147.8
Expenditure 12,920.9 11,549.9 11.9
Profi t before related income tax expense and net fi nance costs 725.8 1,014.0 (28.4)
Net finance costs (54.6) (99.7) (45.2)
Profi t before related income tax expense 671.2 914.3 (26.6)
Income tax expense (191.2) (225.0) (15.0)
Profi t for the year 480.0 689.3 (30.4)
Minority interest (0.5) (0.8) (37.5)
Profi t for the year attributable to members of Qantas 479.5 688.5 (30.4)
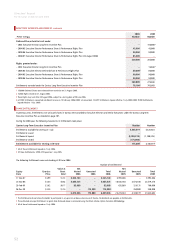
BALANCE SHEET
Total assets 19,183.3 18,390.4 4.3
Total liabilities 13,102.2 12,860.5 1.9
Total equity 6,081.1 5,529.9 10.0
CASH FLOW
Net cash from operating activities 2,026.0 2,101.9 (3.6)
Net cash used in investing activities (889.6) (1,519.7) (41.5)
Net cash used in financing activities (138.2) (43.7) 216.2
Net increase in cash and cash equivalents held 998.2 538.5 85.4
PERFORMANCE RATIOS
Net debt to net debt plus equity (ratio) 27:73 38:62 n/a
Net debt to net debt plus equity including off balance sheet debt and hedge reserve (ratio) 44:56 n/a n/a
Net debt to net debt plus equity including off balance sheet debt and excluding hedge reserve (ratio) 46:54 n/a n/a
Net debt to net debt plus equity including off balance sheet debt and revenue hedge
receivables (ratio) n/a 46:54 n/a
Earnings per share (cents) 24.9 36.8 (11.9) cents
Return on equity (percentage) 7.9 12.5 (4.6) points
Return on equity including the notional capitalisation of non-cancellable operating leases on a
hedged basis (percentage) 7.4 13.8 (6.4) points
Profit before related income tax expense and net finance costs as a percentage of sales and other
income (percentage) 5.3 8.1 (2.8) points
Profit before related income tax expense as a percentage of sales and other income (percentage) 4.9 7.3 (2.4) points