Qantas 2006 Annual Report Download - page 89
Download and view the complete annual report
Please find page 89 of the 2006 Qantas annual report below. You can navigate through the pages in the report by either clicking on the pages listed below, or by using the keyword search tool below to find specific information within the annual report.-
 1
1 -
2
-
3
-
4
-
5
-
6
-
7
-
8
-
9
-
10
-
11
-
12
-
13
-
14
-
15
-
16
-
17
-
18
-
19
-
20
-
21
-
22
-
23
-
24
-
25
-
26
-
27
-
28
-
29
-
30
-
31
-
32
-
33
-
34
-
35
-
36
-
37
-
38
-
39
-
40
-
41
-
42
-
43
-
44
-
45
-
46
-
47
-
48
-
49
-
50
-
51
-
52
-
53
-
54
-
55
-
56
-
57
-
58
-
59
-
60
-
61
-
62
-
63
-
64
-
65
-
66
-
67
-
68
-
69
-
70
-
71
-
72
-
73
-
74
-
75
-
76
-
77
-
78
-
 79
79 -
 80
80 -
 81
81 -
 82
82 -
 83
83 -
 84
84 -
 85
85 -
 86
86 -
 87
87 -
 88
88 -
 89
89 -
 90
90 -
 91
91 -
 92
92 -
 93
93 -
 94
94 -
 95
95 -
 96
96 -
 97
97 -
 98
98 -
 99
99 -
100
-
101
-
102
-
103
-
104
-
105
-
106
-
107
-
108
-
109
-
110
-
111
-
112
-
113
-
114
-
115
-
116
-
117
-
118
-
119
-
120
-
121
-
122
-
123
-
124
-
125
-
126
-
127
-
128
-
129
-
130
-
131
-
132
-
133
-
134
-
135
-
136
-
137
-
138
-
139
-
140
-
141
-
142
-
143
-
144
-
145
-
146
-
147
-
148
 |
 |

87
Qantas Annual Report 2006
Notes to the Financial Statements
for the year ended 30 June 2006
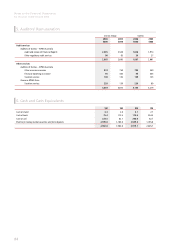
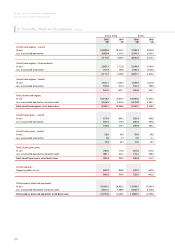
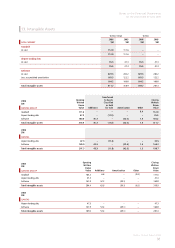
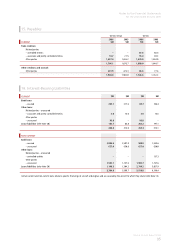
12. Property, Plant and Equipment
Qantas Group Qantas
2006
$M
2005
$M
2006
$M
2005
$M
NON-CURRENT
Freehold land – owned
At cost 65.6 68.0 47.1 47.1
65.6 68.0 47.1 47.1
Leasehold land
At cost 1.8 0.4 ––
Less: accumulated amortisation 0.2 –––
1.6 0.4 ––
Total land at net book value 67.2 68.4 47.1 47.1
Buildings – owned
At cost 272.1 238.1 232.0 194.3
Less: accumulated depreciation 70.8 63.7 55.0 47.5
201.3 174.4 177.0 146.8
Buildings – leased
At cost 60.2 60.7 29.0 29.0
Less: accumulated amortisation 44.7 43.3 19.6 18.7
15.5 17.4 9.4 10.3
Total buildings
At cost 332.3 298.8 261.0 223.3
Less: accumulated depreciation and amortisation 115.5 107.0 74.6 66.2
Total buildings at net book value 216.8 191.8 186.4 157.1
Leasehold improvements
At cost 1,252.3 1,268.6 759.9 766.4
Less: accumulated amortisation 703.9 670.8 388.7 368.1
Total leasehold improvements at net book value 548.4 597.8 371.2 398.3
Plant and equipment – owned
At cost 1,220.7 1,766.2 1,006.1 1,365.3
Less: accumulated depreciation 709.2 1,256.6 550.3 917.1
511.5 509.6 455.8 448.2
Plant and equipment – leased
At cost 7.0 7.0 ––
Less: accumulated amortisation 6.8 6.5 ––
0.2 0.5 ––
Total plant and equipment
At cost 1,227.7 1,773.2 1,006.1 1,365.3
Less: accumulated depreciation and amortisation 716.0 1,263.1 550.3 917.1
Total plant and equipment at net book value 511.7 510.1 455.8 448.2