Qantas 2006 Annual Report Download - page 48
Download and view the complete annual report
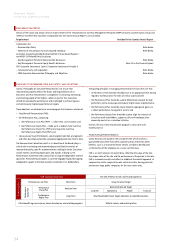
Please find page 48 of the 2006 Qantas annual report below. You can navigate through the pages in the report by either clicking on the pages listed below, or by using the keyword search tool below to find specific information within the annual report.-
 1
1 -
2
-
3
-
4
-
5
-
6
-
7
-
8
-
9
-
10
-
11
-
12
-
13
-
14
-
15
-
16
-
17
-
18
-
19
-
20
-
21
-
22
-
23
-
24
-
25
-
26
-
27
-
28
-
29
-
30
-
31
-
32
-
33
-
34
-
35
-
36
-
37
-
 38
38 -
 39
39 -
 40
40 -
 41
41 -
 42
42 -
 43
43 -
 44
44 -
 45
45 -
 46
46 -
 47
47 -
 48
48 -
 49
49 -
 50
50 -
 51
51 -
 52
52 -
 53
53 -
 54
54 -
 55
55 -
 56
56 -
 57
57 -
 58
58 -
59
-
60
-
61
-
62
-
63
-
64
-
65
-
66
-
67
-
68
-
69
-
70
-
71
-
72
-
73
-
74
-
75
-
76
-
77
-
78
-
79
-
80
-
81
-
82
-
83
-
84
-
85
-
86
-
87
-
88
-
89
-
90
-
91
-
92
-
93
-
94
-
95
-
96
-
97
-
98
-
99
-
100
-
101
-
102
-
103
-
104
-
105
-
106
-
107
-
108
-
109
-
110
-
111
-
112
-
113
-
114
-
115
-
116
-
117
-
118
-
119
-
120
-
121
-
122
-
123
-
124
-
125
-
126
-
127
-
128
-
129
-
130
-
131
-
132
-
133
-
134
-
135
-
136
-
137
-
138
-
139
-
140
-
141
-
142
-
143
-
144
-
145
-
146
-
147
-
148
 |
 |

46
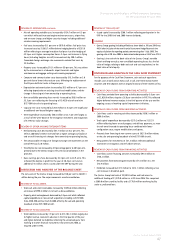
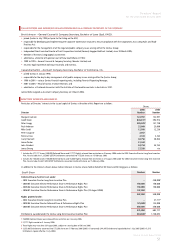
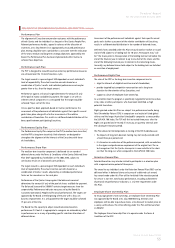
REVIEW OF INCOME STATEMENT
• Profit before related income tax expense (PBT) was $671.2 million,
a decrease of $243.1 million or 26.6 per cent. Profit attributable to
members of Qantas was $479.5 million.
• PBT for Qantas operations (including QantasLink and Australian Airlines)
totalled $578.4 million, a decline of $212.4 million or 26.9 per cent on
the prior year. Net passenger revenue increased by 8.0 per cent,
including fuel surcharge recoveries, reflecting a 7.9 per cent
improvement in yield (excluding unfavourable foreign exchange rate
movements) and a 1.0 point increase in seat factor to 77.2 per cent.
Capacity increased by 0.8 per cent reflecting the commencement of
services to Beijing and San Francisco and the new Dash 8-Q400
turboprop aircraft within QantasLink, offset by the transfer of some
trans-Tasman and domestic flying to Jetstar. Net expenditure increased
by 11.5 per cent, predominantly due to the impact of fuel price increases
and restructuring costs.
• Jetstar recorded a PBT result of $10.8 million which included $4.0
million of start-up costs for trans-Tasman operations and $10.2 million
in costs associated with the launch and set-up of Jetstar International.
Excluding these costs, Jetstar’s PBT was $25.0 million, which was a
decline of $10.6 million on the prior year. PBT was impacted by
increased fuel costs and higher lease costs reflecting the transition to an
all A320-200 fleet.
• PBT for non-flying subsidiary businesses declined by $15.2 million or
11.3 per cent largely due to reduced PBT by Qantas Holidays and the
write-down of the investment in Orangestar.
REVIEW OF SALES AND OTHER INCOME
• Total sales and other income for the year increased by $1,082.8 million
to $13.6 billion, an increase of 8.6 per cent on the prior year. Excluding
the unfavourable impact of foreign exchange movements, sales and
other income increased by $1,179.8 million or 9.4 per cent.
• Net passenger revenue increased by $932.4 million to $10.5 billion, an
increase of 9.7 per cent. Excluding the unfavourable impact of exchange
rate movements, revenue increased by 10.7 per cent due to growth in
traffic of 4.5 per cent and an improvement in yield (excluding exchange)
of 6.9 per cent. Overall, Qantas Group capacity increased by 3.6 per cent
compared with the prior year.
• Other revenue categories increased by $150.4 million to $3.1 billion, an
increase of 5.0 per cent. This was primarily due to an increase in freight
revenue of $127.9 million.
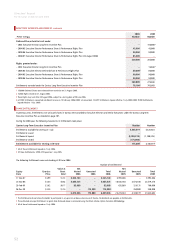
REVIEW OF EXPENDITURE
• Total expenditure, including net financing costs, increased by $1,325.9
million or 11.6 per cent to $12.9 billion. Excluding the favourable impact
of movements in foreign exchange rates, total expenditure increased by
$1,420.9 million or 12.2 per cent. Excluding fuel which increased by
$870.6 million, and restructuring costs of $181.5 million, expenditure
increased by $273.8 million or 2.8 per cent, which is lower than the 3.6
per cent increase in capacity.
• Net expenditure cost per ASK increased by 10.9 per cent. After
eliminating the impact of unfavourable fuel cost movements and
restructuring expenses, unit costs improved by 2.2 per cent.
• Manpower and staff related expenditure increased by $158.2 million or
5.0 per cent, driven by $134.2 million of business restructuring costs.
Activity growth and a 3.0 per cent Enterprise Bargaining Agreement
(EBA) wage increase were largely offset by productivity and other cost
improvement initiatives. Full-time equivalent employees (FTEs)
decreased by 1.9 per cent on the prior year.
• Selling and marketing expenditure decreased by $32.0 million or 6.4 per
cent largely due to lower national advertising costs and favourable
foreign exchange.
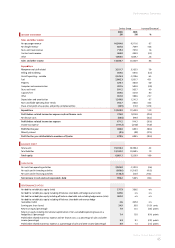
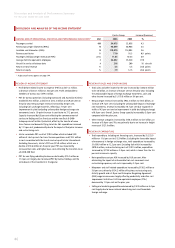
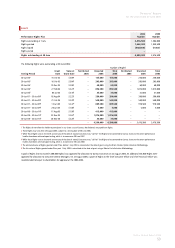
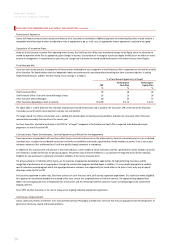
Discussion and Analysis of Performance Summary
for the year ended 30 June 2006
DISCUSSION AND ANALYSIS OF THE INCOME STATEMENT
Qantas Group Increase/(Decrease)
QANTAS GROUP OPERATIONAL STATISTICS AND PERFORMANCE INDICATORS* Unit 2006 2005 %
Passengers carried 000 34,075 32,658 4.3
Revenue passenger kilometres (RPKs) M 90,899 86,986 4.5
Available seat kilometres (ASKs) M 118,070 114,003 3.6
Revenue seat factor % 77.0 76.3 0.9 points
Passenger yield (passenger revenue per RPK) cents 11.05 10.34 6.9
Average full-time equivalent employees # 34,832 35,520 (1.9)
Aircraft in service at balance date # 216 200 16 aircraft
Return on total revenue % 3.5 5.5 (2.0) points
Return on equity % 7.9 12.5 (4.6) points
* A glossary of terms appears on page 144.